MPD 575 Design for Reliability
520 likes | 698 Vues
MPD 575 Design for Reliability. Jonathan Weaver. DReliability Development History. Originally developed by MPD Cohort 3 team of Julie Earle, Dave Herczeg, and Jim Van Gilder in Fall 2002. Design for Reliability. Why Design for Reliability?.

MPD 575 Design for Reliability
E N D
Presentation Transcript
MPD 575Design for Reliability Jonathan Weaver
DReliability Development History • Originally developed by MPD Cohort 3 team of Julie Earle, Dave Herczeg, and Jim Van Gilder in Fall 2002.
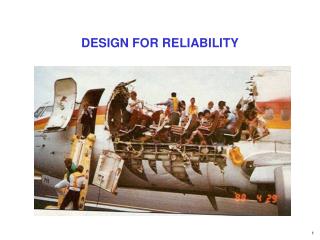
Why Design for Reliability? • Reliability can make or break the long-term success of a product: • Too high reliability will cause the product to be too expensive • Too low reliability will cause warranty and repair costs to be high and therefore market share will be lost
What is Reliability? • Reliability is: • Elimination/avoidance of failure modes/mistakes • The probability that a product will perform its intended function: • Under customer operating conditions • For a specified life • In a manner that meets or exceeds customer expectations • A reliable product is robust and mistake-free
What is Probability? • Probability is: • a measure that describes the chance or likelihood that an event will occur. • The probability that event (A) occurs is represented by a number between 0 (zero) and 1. • When P(A) = 0, the event cannot occur. • When P(A) = 1, the event is certain to occur. • When P(A) = 0.5, the event is as likely to occur as it is not.
Reliability Failure Modes Two types of failure mode: a) hard = something breaks b) soft = performance degrades Two root causes: 1. lack of robustness (sensitivity to noise factors) 2. mistakes
What are Noise Factors? • Noise Factors are sources of disturbing influences that can disrupt the ideal function, causing error states which lead to quality problems.
What is Population and Sample Size? • A population is: • The entire group to be studied (e.g. all Ford Contours) • A sample is: • A subset of a population selected randomly for analysis (e.g., every hundredth Ford Contour off the assembly line)
Common Measures of Unreliability • % Failure - % of failures in a total population • MTTF (Mean Time To Failure) - the average time of operation to first failure. • MTBF (Mean Time Between Failure) - the average time between product failures. • Repairs Per Thousand (R/1000) • Bq Life – Life at which q% of the population will fail
Introduction to DFR • DFR has many aliases: • Design for Durability • Design for Robustness • Design for Useful Life
When to Use DFR • DFR should be considered throughout the PD cycle: • Early - to develop "product concepts" which are well suited for production (i.e., conceptual product design) • Continually - to ensure that the chosen product concept is implemented through optimal component design
Automotive Reliability Facts • The shortest route to higher satisfaction is not only through the dealership service department – it is mainly through keeping customers out of the service department in the first place. • Customers who report zero problems with their new cars have an owner loyalty rate of 73 percent and dealer loyalty of 42 percent. • At 4 TGW, loyalty to the company drops by 1/3 to 44%, while loyalty to the dealer drops to zero.
Automotive Reliability Facts • The average age of a purchased vehicle at the time of replacement is 5.7 years in the U.S. and 4-5 years in Europe. • The average lifetime of a vehicle before scrap is 12.7 years in the U.S. and 10 years in Europe.
Steps in Designing for Reliability • Develop a Reliability Plan • Determine Which Reliability Tools are Needed • Analyze Noise Factors • Tests for Reliability • Track Failures and Determine Corrective Actions
1. Develop a Reliability Plan • Planning for reliability is just as important as planning for design and manufacturing. Why? To determine: • useful life of product • what accelerated life testing to be used • where to begin • Reliability must be as close to perfect as possible for the product’s useful life.
1. Develop a Reliability Product Plan • A Reliability Plan helps ensure that product reliability is optimized within the cost and performance constraints of a program and customer requirements.
1. Develop a Reliability Plan • How much reliability do you need? Should you accelerate life testing? Where do you even begin? • Planning for product reliability is just as important as planning for product design and manufacturing. • The amount of product reliability must be in proportion to a product's usage and warranty goals. Too much reliability and the product will be too expensive. Too little reliability and warranty and repair costs will be high. • You MUST know where your product's major points of failure are!
Some Reliability Tools • Block Diagram • P-Diagram • QFD • DFMEA & PFMEA • Design Verification Plan • Key Life Testing • Weibull Testing • Reliability Demonstration Matrix
Reliability Block Diagram • Three categories: • Series • Parallel (Redundant) • Complex (combo of the two – shown below)
P-Diagram Noises Input Outputs J System Signal IDEAL Response (energy related) (energy related) error states/ failure modes L Control Factors
FMEAs • Potential Failure Mode • Potential Effects of Failure • Severity • Classification • Potential Cause/Mechanism of Failure • Occurrence • Design Controls (Prevention/Detection) • Detection • Risk Priority Number • Recommended Actions • Responsibility/Target Completion Date • Actions
DVP&Rs • Test Specification • Acceptance Criteria • Test Results • Design Level • Quantity Required • Quantity Tested • Scheduled Start/ Complete • Actual Start/ Complete • Remarks
Reliability Demonstration Matrix Robustness Assessment and Noise Factor Management Matrix “In the development of robustness, it is essential to provide one noise condition for each failure mode”. Don Clausing, Professor of Engineering, MIT. Potential Failure modes Available Tests Failure mode to test traceability and Noise factor to test traceability leading to ... Reliability & Robustness Demonstration Noises #1 Noise factor management strategy Noises #2 Noise to failure mode traceability Noises #3 Noises #4 Noises #5
Reliability Demonstration Matrix Robustness Demonstration Battery Suspension bushing
2. Analyze Noise Factors • Inner Noises • Wear-out or fatigue • Piece-to-piece variation • Interfaces with neighboring subsystems • Outer Noises • External Operating Environment (e.g., climate, road conditions, etc.) • Customer usage / duty cycle
2. Reduce Sensitivity to Noise Factors • Change the design concept • Make basic current design assumptions insensitive to the noises – design out failure • Parameter Design • Beef Up Design • Insert a compensation device • Disguise the effect - Send the error state/noise where it will do less harm
2. Noise Factor Management 1. 2. 3. 4. 5. Change (i)Parameter (ii)Beef-up Reduce Comp- Disguise Concept Design. Design Noise ensate Piece-to-piece x x x Wear Out x x x Customer Use x x x External Environmentx x x System Interactions x x x x
3. Test for Reliability • How robust are the products? • Test to Bogey: assessing performance at a predetermined time, cycle or number of miles. It estimates the proportion of failures at a particular time. pass/fail • Test to Failure: shows when a component or system can no longer perform at a specified level • Degradation Testing: focuses on the key stresses associated with real world uses – for example - increasing the tire load to create a tire failure • How can you shorten the reliability test time for new designs? • Key Life Test/Accelerated Test
3. Example – Testing for Reliability • Proportional Hazard Model to Tire Design Analysis • Perform Root cause analysis • Consists of laboratory tests aimed to duplicate field failures • Tire geometry and physical properties are selected as variables that potentially affect the tire • Survival data is analyzed by a proportional hazard model • The adequacy is assessed by the chi-square goodness- of fit test and the Cox-Snell residual analysis • Identify elements of a tire design that affect the probability of tire failure due to failure mode in question.
3. Example - Testing for Reliability Cont’d • Type of failure mode analyzed – tread and belt separation
3. Example - Testing for Reliability Cont’d • Tread and belt separation can be considered a sequence of two events: • Failure crack initiation in the wedge area • Crack propagation between the belts • Design characteristics that could be variables: • Tire age • Wedge gauge • Interbelt gauge • End of belt # 2 to buttress • Peel force • Percent of carbon black (chemical in rubber)
3. Example - Testing for Reliability Cont’d • Testing procedure • Dyno testing • Warm up over 2 hours at 50 mph • Cool down over 2 hour at full stop • At 1300 lbs of load: speed steps starting at 75 mph and increasing by 5 mph every half hour till 90 mph and then every hour till failure • At 1500 lbs of load: all the above speed steps are half-hour duration
3. Example - Testing for Reliability Cont’d • Test speed profile
3. Example - Testing for Reliability Cont’d • Vibration and sound pattern of tire before tread and belt separation failure
3. Example - Testing for Reliability Cont’d • Test data set used in proportional hazard analysis
3. Example - Testing for Reliability Cont’d • Estimates of proportional hazard model with covariates identified
3. Example - Testing for Reliability Cont’d • Estimates of Proportional Hazard Model with statistically significant covariates
3. Example - Testing for Reliability Cont’d • Exponential probability plot of Cox-Snell Residuals
3. Example - Testing for Reliability Cont’d • Cumulative Hazard function predicted from the estimated model based on some typical values of covariates for “poor” and “good” tires
3. Example - Testing for Reliability Cont’d • Conclusion • Wedge and interbelt gauges as well as the peel force are significant factors affecting hazard rate of tire and belt separation failures in an inversely proportional way • Agree with hypothesis
3. Test for Reliability • Component design and manufacturing technologies are becoming increasingly complex. • As geometries shrink and development cycles shorten, opportunities for defects increase. • Testing for Reliability is becoming increasingly important.
4. Track Failures and Determine Corrective Actions • This process involves: • Data collection and selection • Set up databases for tracking failures • Warranty, Early Warranty, Things Gone Wrong • Analyzing trends • Performing closed loop analysis/corrective action • Calculating observed reliability parameters • Assessing reliability growth.
4. Track Failures and Determine Corrective Actions • Brake warranty is on track with targets and achieves more than 60% warranty CPU reduction since 1994 • Brake health charts were instituted in 1995 to monitor key performance index and drive design competency • Supplier business unit reviews (BURS) quarterly to address key quality and manufacturing issues
4. Track Failures and Determine Corrective Actions • Time-to-Failure Curve
Challenges in DFR • Many CAE models have limited capability to represent real-world noise; therefore, surrogate noise based on engineering knowledge is required. • Precise reliability estimates require precise knowledge of statistical distributions of noise factors. • As a contrast, comparative reliability assessments and robust design require only approximate knowledge of statistical distributions.
Challenges in DFR • Many CAE models are computationally expensive • preparation time to set up the model • computing time • Many CAE models focus on “error states” (e.g., fatigue, vibration, noise); therefore, a multi-objective optimization is often needed. • In early product development, when the impact of robust design can be greatest, design objectives and constraints are still imprecise.
References • Reliability - Ford Design Institute • Ford Reliability Class – T. P. Davis, V. Krivtsov/ VKRIVTSO • http://www.reliabilityanalysislab.com/ReliabilityServices.asp • U.S.: R.L. Polk Vehicles in Operation Report June, 1997 Europe: New Car Buyer StudyEuropean Buyer - Big Five Survey 1995 • Ford's Strategy in Reliability (Prof. Tim Davis) • http://pms401.pd9.ford.com:8080/arr/concept.htm