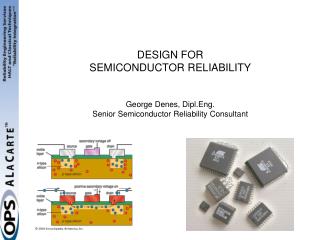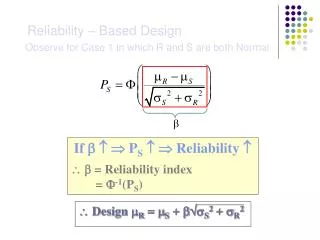
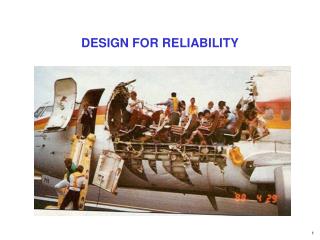
DESIGN FOR RELIABILITY
DESIGN FOR RELIABILITY. DESIGN FOR RELIABILITY WHY NOW? WHY SO LATE IN MME2259a? Because reliability may depend on details of design. DESIGN FOR RELIABILITY. HYATT’S SKY WALK COLLAPSE. Original Design. As Built. HYATT’S SKY WALK COLLAPSE. Original Design. As Built.

DESIGN FOR RELIABILITY
E N D
Presentation Transcript
DESIGN FOR RELIABILITY WHY NOW? WHY SO LATE IN MME2259a? Because reliability may depend on details of design
HYATT’S SKY WALK COLLAPSE Original Design As Built
HYATT’S SKY WALK COLLAPSE Original Design As Built http://www.designcommunity.com/discussion/10175.html
HARTFORD CIVIC CENTRE ARENA ROOF COLLAPSE http://www.eng.uab.edu/cee/faculty/ndelatte/case_studies_project/Hartford%20Civic%20Center/hartford.htm#Top
SINKING OF SLEIPNER A PLATFORM http://www.ima.umn.edu/~arnold/disasters/sleipner.html
TOW TRUCK TOWING HITCH FAILURE Original Design As Built “Fundamentals of Engineering Design” Barry Hyman, Prentice Hall
STUDY OF FAILURE • Failure of materials • Failure of components/devices • Failure of structures • Failure of systems • ???
Reliability A measure of how a product maintains quality over time (Quality, in this context, is in terms of satisfactory performance understated set of operating conditions). Failure Failure is a non-satifactory performance. Mechanical failure is any change or any design or manufacturing error that renders a component, assembly, or system incapable of performing its intended function. RELIABILITY AND FAILURE
TYPICAL SOURCES OF FAILURE • Wear • Fatigue • Yielding • Jamming • Bonding weakness • Property change • Buckling • Imbalance
EXAMPLES OF MECHANICAL FAILURE MODES • Structural fracture; excessive deflection, buckling • Thermodynamic overheating; reduction in efficiency • Fluid leakage; distorted flow • Kinematic bearing seizure; reduction in the accuracy of the relative movement • Hydraulic actuation fitting leakage, static seal leak, fluid dirt contamination, actuator cylinder rupture
EXAMPLES OF MECHANICAL FAILURE MODES • Vibrations • Sagging • Cracking • Stall • Creep • Thermal expansion • UV deterioration • Acoustic noise • Scratching and hardness • Loose fitting • Radiation damage • Erosion • Thermal shock • Corrosion • Fracture • Material Yield • Electrical short • Open circuit • Buckling • Resonance • Fatigue • Deflections or deformations • Seizure • Burning • Misalignment • Wear • Binding • Overshooting (control) • Ringing • Leaking
DESIGN CONSIDERATIONS IN DESIGN FOR RELIABILITY • 1. Initial manufacturing costs may increase as the reliabilityis improved - however, overall life-cycle costs can decrease. • 2. The ideal objective is to achieve operating reliability while limiting theimpact on manufacturing costs. • 3. The designer can control reliability by appropriate combination of: • a sound concept • careful detailed design • high-quality components • redundancy of critical elements • ample safety factors
FACTOR OF SAFETY AS A DESIGN VARIABLE • Factor of Safety is a factor of ignorance. • In relation to stress, it is used to: • To reduce the allowable strength (eg. yield or ultimate strength of a material) to a lower level for comparison with the applied stress • To increase the applied stress for comparison with the allowable strength • As a comparison for the ratio of the allowable strength to the applied stress
FACTOR OF SAFETY AS A DESIGN VARIABLE FS = FSmaterial x FSstress x FSgeometry x FSfailure analysis x FSreliability • Estimating the contribution for material: • FSmaterial = 1.0 • If the properties for the material are well known; if they have been experimentally determined from tests on a specimen known to be identical to the component being designed; and from tests representing the loading to be applied. • FSmaterial = 1.1 • If the material properties are known from a handbook or are manufacturer’s values. • FSmaterial = 1.2 – 1.4 • If the material properties are not well known.
FACTOR OF SAFETY AS A DESIGN VARIABLE FS = FSmaterial x FSstress x FSgeometry x FSfailure analysis x FSreliability • Estimating the contribution for the load stress: • FSstress = 1.0 - 1.1 If the load is well defined as static or fluctuating; if there are no anticipated overloads or shock loads; and if an accurate method of analyzing the stress has been used. • FSstress = 1.2 - 1.3 If the nature of the load is defined in an average manner, with overloads of 20%-50%, and stress analysis method may result in errors less than 50%. • FSstress = 1.4 - 1.7 If the load is not well known or stress analysis method is of doubtful accuracy.
FACTOR OF SAFETY AS A DESIGN VARIABLE FS = FSmaterial x FSstress x FSgeometry x FSfailure analysis x FSreliability • Estimating the contribution for geometry (unit-to-unit variations): • FSgeometry= 1.0 If tolerances are tight and held well • FSgeometry = 1.0 If tolerances are average • FSgeometry= 1.1 – 1.2 If the dimensions are not closely held.
FACTOR OF SAFETY AS A DESIGN VARIABLE FS = FSmaterial x FSstress x FSgeometry x FSfailure analysis x FSreliability • Estimating the contribution for failure analysis: • FSfailure theory = 1.0 - 1.1 • If the failure analysis to be used is derived for the state of stress, as for uniaxial or multiaxial static stresses, or fully reversed uniaxial fatigue stresses. • FSfailure theory = 1.2 • If the failure analysis to be used is a simple extension of the above theories, such as for multiaxial, fully reversed fatigue stresses or uniaxial nonzero mean fatigue stresses. • FSfailure theory = 1.3 - 1.5 • If the failure analysis is not well developed, as with cumulative damage or multiaxial nonzero mean fatigue stresses.
FACTOR OF SAFETY AS A DESIGN VARIABLE FS = FSmaterial x FSstress x FSgeometry x FSfailure analysis x FSreliability • Estimating the contribution for reliability: • FSreliability =1.1 If the reliability for the part need not be high, for instance, less than 90 percent. • FSreliability =1.2-1.3 If the reliability is an average of 92% - 98%. • FSreliability =1.4-1.6 If the reliability must be high, eg. greater than 99%
FACTOR OF SAFETY AS A DESIGN VARIABLE In order to use the factor of safety, failure mode must be known! It is not always excessive stress that causes structural failure! Forgetting about failure mode such as displacement or buckling is a very common error. support Buckled shape Load
Reliability A measure of how a product maintains quality over time (Quality, in this context, is in terms of satisfactory performance understated set of operating conditions). Failure Failure is a non-satifactory performance. Mechanical failure is any change or any design or manufacturing error that renders a component, assembly, or system incapable of performing its intended function. RELIABILITY AND FAILURE
RISK AND HAZARD Risk likelihood of harm (accident) Hazard potential to cause harm (accident) Risk Assessment The process and procedures of identifying,characterizing, quantifying and evaluating risks and theirsignificance. Risk Management Use of techniques that either minimize the probability of an accident or alleviate its consequences.
RISK ASSESSMENT • Three types of risk in engineering systems • Risks that were acceptable at the time of design, but arenow considered health or safety hazards • Risks that come from abnormal conditions that are not partof the basic design concept • Risks associated with design errors • In general, risk assessment techniques attempt to • Identify potential causes of failure • Rate them in terms of criticality • Establish the conditions under which the failure hasgreatest likelihood of occurance and/or gravest consequence
DESIGN FOR RELIABILITY TOOLS IN MME2259A • The designer needs some means of determining the reliability of design alternativesand procedures to identify potential hazards and failures: • Preliminary Hazard Analysis (PHA) • Fault Tree Analysis • Failure Mode And Effect Analysis (FMEA)
HAZARD ANALYSIS • Hazard Analysis is the designer’s response to ensuring product safety. • Important to foresee every conceivable way that the product will be used and misused (including transport, storage, maintenance, repair, …) • Careful records must be maintained, this forces the engineer to justify design decisions + records may become legal documents. • Detailed hazard analysis establishes the rationale for dealing with all possible hazards (this may be needed in the future if accidents occur or litigation).
PRELIMINARY HAZARD ANALYSIS (PHA) System hazards are not (yet) failures. Failures may contribute to hazards, but hazards are system states that, combined with certain environmental conditions, cause accidents.
PRELIMINARY HAZARD ANALYSIS (PHA) PHA is a broad study made in the early stages of design. The PHA consists of breaking the engineering system down into subsystems or components, and for each item answering the following questions: • What is the subsystem or item under investigation? • What is the mode of operation? • What is the hazardous condition and why? • What event(s) triggers the hazardous condition? • What is the hazardous condition? • What event(s) triggers the potentialaccident? • What is the potential accident? • What is the possible effect(s) of the accident? • 9. What is the classification of the severity of the hazard? • 10. What measures are taken to contain or prevent occurences?
PRELIMINARY HAZARD ANALYSIS (PHA) • Severity level classification from an aviation standard: • Class I: Catastrophic • Un-survivable accident with hull loss. • Class II: Critical • Survivable accident with less than full hull loss; fatalities possible • Class III: Marginal • Equipment loss with possible injuries and no fatalities • Class IV: Negligible • Some loss of efficiency Procedures able to compensate, but controller workload likely to be high until overall system demand reduced. Reportable incident events such as operational errors, pilot deviations, surface vehicle deviation. safeware-eng.com
FAULT TREE ANALYSIS Fault tree analysis is a technique that provides a systematic description of possible occurrences in a system that can result in “failure” or “severe accident”. The four basic steps involved in developing a fault tree are as follows: 1. Develop the top undesired event of the system to be studied. 2. Develop a thorough understanding of the system under consideration. 3. Determine the logical interrelationships of higher-level and lower-level fault events. 4. Construct the fault tree using logical symbols.
FAULT TREE ANALYSIS Basic symbols used in fault trees: Resultant fault event: a rectangle denotes a fault event that results from a combination of failure events through the input of a logic gate, such as an AND gate or an OR gate Basic fault event: a circle denotes a basic fault event or the failure of an elementary component. The values of the parameters, such as failure probability, unavailability, failure rate, and repair rate, associated with the basic fault event are obtained from empirical studies or other sources AND gate: denotes that an output fault event occurs if all of the input fault events occur OR gate: denotes that an output fault event occurs if one or more of the input fault events occur
FAULT TREE ANALYSIS AND gate OR gate Resultant fault event AND OR Gate All basic fault events must occur in order for resultant event to occur At least one basic fault event must occur in order for the resultant event to occur Basic fault events
FAULT TREE ANALYSIS The output fault occurrence probabilities for AND gate is: where FAND is the probability of occurrence of the AND gate output fault event m is the number of independent input fault events Fi is the probability of occurrence of input fault event i, for i=1, 2, …m OUTPUT EVENT FAND Example: F1 = 0.1 F2 = 0.05 FAND = 0.1 * 0.05 = 0.005 AND INPUT EVENTS F1 F2
FAULT TREE ANALYSIS The output fault occurrence probabilities for OR gate: where FORis the probability of occurrence of the OR gate output fault event m is the number of independent input fault events Fi is the probability of occurrence of input fault event i, for i=1, 2, …m FOR OUTPUT EVENT Example: F1 = 0.1 F2 = 0.05 FOR = 1 – (1 - 0.1)*(1- 0.05) = 0.145 OR F1 F2 INPUT EVENTS Note: For small (i.e. less than 10 percent) occurrence probabilities of input fault events of the OR gate, the above equation reduces to:
FAULT TREE ANALYSIS • Example: Develop a fault tree for a system comprising of a windowless room with one switch and three light bulbs. The switch can only fail to close, and the top undesirable event is the room without light. TOP EVENT OR FAULT EVENT OR AND BASIC FAULT EVENT [Dhillon 1996] BASIC FAULT EVENT
[Dhillon 1996] FAULT TREE ANALYSIS Example: (cont'd) Assume that the probabilities of occurrence of basic fault events A ,B, C, D. E, and F are 0.1, 0.12,0.15, 0.15, 0.15, and 0.08, respectively. Calculate the probability of occurrence of the top event (T) (i.e. the room without light). Probability of having a room without light is 27% OR OR AND
FAULT TREE ANALYSIS • Develop a fault tree for a climb. • The top undesirable event is not making it to the summit by at least one member of your team • You climb in a team which can not split. • Team is lead by a guide. • Each team member on your team has 40% probability of failure • Guide has 10% probability of failure • Weather/terrain has 20% probability of turning bad • What is the probability of the climb failure?
OR OR TWO CLIMBERS PLUS GUIDE 1 – (1- 0.676) (1- 0.2) = 0.74 0.74 1 – (1- 0.4) (1- 0.4)(1- 0.1) = 0.676 0.676 0.2 0.4 0.4 0.1
OR OR SINGLE CLIMBER PLUS GUIDE version 1 1 – (1- 0.46) (1- 0.2) = 0.568 0.568 0.460 0.2 1 – (1- 0.4) (1- 0.1) = 0.460 0.4 0.1
OR OR SINGLE CLIMBER PLUS GUIDE version 2 1 – (1- 0.24) (1- 0.1) = 0.568 0.316 0.24 0.1 1 – (1- 0.2) (1- 0.05) = 0.24 0.2 0.05
FAILURE MODES AND EFFECTS ANALYSIS (FMEA) Failure effects FMEA Failure modes Failure effects FMECA Failure modes Failure criticality
FAILURE MODES AND EFFECTS ANALYSIS (FMEA) • Failure Mode and Effect Analysis (FMEA) is a very common analysis method used to improve product reliability and safety. • It is used to identify: • how a product can fail (its failure modes) • the causes of those failures • the effects of the failures on system/product performance
FAILURE MODES AND EFFECTS ANALYSIS (FMEA) • Failure Modes and Effects Analysis • is a detailed analysis of the malfunctions that can be producedin the components of an engineering system. Similar to the QFD approach, FMEA techniques involve charts that are developed, amended and updated over time. • Primary Goal of Failure Modes and Effects Analysis • is to try to identify and list all possible ways in which product or a process could fail to conform to its specified requirements. [McMahon and Bowne 1993]