Reliability based design optimization
Reliability based design optimization. Probabilistic vs. deterministic design Optimal risk allocation between two failure modes. Laminate design example Stochastic, analysis, and design surrogates. Uncertainty reduction vs. extra weight. Deterministic design for safety.


Reliability based design optimization
E N D
Presentation Transcript
Reliability based design optimization • Probabilistic vs. deterministic design • Optimal risk allocation between two failure modes. • Laminate design example • Stochastic, analysis, and design surrogates. • Uncertainty reduction vs. extra weight.
Deterministic design for safety • Like probabilistic design it needs to lead to low probability of failure. • Instead of calculating probabilities of failure use array of conservative measures. • Safety factors. • Conservative material properties. • Tests • Accident investigations • Risk allocation driven by history (accidents).
Pro and cons of probabilistic design • Probabilistic design requires more data, that is often not available or expensive to get. • Probabilistic design may require to accept finite probability of death or injury and may lead to legal liabilities. • Probabilistic design may allow more economical risk allocation. • Probabilistic design may allow trading measures for compensating against uncertainty against measures for reducing it.
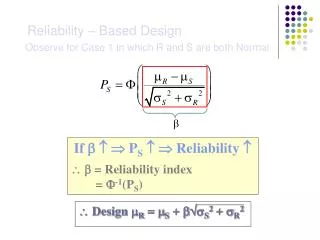
Optimal risk allocation • If there is a single failure mode, the chances are that history has resulted in safety factors that reflect the desired probability of failure. • When there are multiple failure modes it makes sense to have excessive protection against modes that are cheap to protect against. • Adding probabilities : If one mode has failure probability p1 and a second p2, what is the system failure probability if they are independent?
Example • An airplane wing weighs 10,000 lb and the tail weighs 1,000 lb. With a safety factor of 1.5, each has a failure probability of 1%, for a total failure probability of 2% (actually 1-0.99^2) • For each component the relation between the probability of failure and additional weight is • Reduce the failure probability to 0.5% with minimum weight. • Adding 200 lb to wing and 20 lb to tail reduces the probabilities of each by a factor of 4 for 220 lbs. • Adding 120 lb to the wing and 80 lb to the tail will lead to 0.435% wing failure probability plus 0.004% tail failure probability. Safer and lighter. • What is the optimum?
Problems risk allocation • In a design problem g=r-c, and the costs of changing the means of r or c by one unit are the same. The standard deviation of r is twice that of c. Which mean should we change to reduce the Pf at minimum cost? • Response • Capacity • Both • What is the optimal solution for the example on slide 5?
FORM vs. Monte Carlo • FORM is much cheaper, but • Does not give you good estimate of system probability of failure when failure modes are strongly coupled. • Can have large errors when variables are far from normal and limit state have multiple local MPPs. • More difficult to allocate risk. • MCS usually too expensive unless you fit a surrogate to limit state function.
Deterministic Design of Composite Laminates • Design of angle-ply laminate • Maximum strain failure criterion Load induced by internal pressure: NHoop = 4,800 lb./in., NAxial = 2,400 lb./in. .
Physical challenge in this problem • In a cylinder under internal pressure the stresses in the hoop directions are twice those in the axial direction, and so you could put fibers in both directions, but twice as many in the hoop direction. • However, fibers shrink much less than matrix at low temperatures, so the fibers in hoop direction will not allow the matrix of the axial fibers to shrink, causing it to crack. • We have to compromise by having fibers in intermediate directions with less than 90-degrees between fibers in different layers of laminate.
Summary of Deterministic Design • Optimal ply-angles are 27 from hoop direction • Laminate thickness is 0.1 inch • Probability of failure (510-4) is high with safety factor 1.4. .
Top Hat problem • If the 27o design was built with 26o because of manufacturing reliability that would • Increase the chance of failure due to hoop stress • Increase the chance of failure due to axial stress • Increase the chance of failure due to matrix cracking • All of the above.
Reliability-based Laminate Design • 4 Design Variables • 1, 2, t1, t2 • 12 Normal Random Variables • Tzero (CV = 0.03) • 1, 2 (CV = 0.035) • E1, E2, G12, 12 (CV = 0.035) • 1c, 1t (CV = 0.06) • 2c, 2t, 12u (CV = 0.09) Pt= 10-4 • First ply failure principle .
Response Surface Options • Design response surface approximation (DRS) • Response or Probability v.s. design variables: G=G(d) • Used in optimization • Stochastic response surface approximation (SRS) • Responsev.s. random variables: G=G(x) • Used in probability calculation. • Need to construct SRS at every point encountered in optimization • Analysis response surfaces • Responsev.s. random variables+ design variables: G=G(x, d) • Advantage:improve efficiency of SRS • Challenge: • Construct RS in high dimensional space ( > 10 variables) xueyong@mae.ufl.edu
Strain ARS R.V. D.V. Analysis Response Surfaces (ARS) • Fit strains in terms of 12 variables • Design of experiments: • Latin Hypercube Sampling (LHS) • Probabilities calculated by MCS based on fitted polynomials • Reduce computational cost of MCS xueyong@mae.ufl.edu
Probability ARS DOE & MCS ti DRS i Optimization No No Converge? Yes Stop Reliability-based Design Optimization • Design Response Surface (DRS) • Fit to Probability in terms of 4 D.V. • Filter out noise generated by MCS • Used in RBDO xueyong@mae.ufl.edu
Approximation xueyong@mae.ufl.edu
Optimization • Deterministic, Reliability-based, and Simplified designs • The thickness is high for application xueyong@mae.ufl.edu
Improving Reliability-based Design • Reliability-based design • Thickness of 0.12 inch • Probability of failure of 10-4 level Must reduce uncertainties: • Quality control (QC) • Reject small numbers of poor specimen • Truncate distribution of allowables at lower side (–2) • Reduce material scatter • Reduce Coefficient of Variation (CV) • Better manufacture process (Better curing process) • Improve allowables • Increase Mean Value of allowables • New materials xueyong@mae.ufl.edu
Change Distribution of 2 allowable • Reduce scatter (CV) by 10% • Increase allowable (Mean value) by 10% xueyong@mae.ufl.edu
Quality Control (QC) on2 allowable • Reduce probability of failure • Reduce thickness xueyong@mae.ufl.edu
Tradeoff Plot • To be chosen by the cost of implementing these methods xueyong@mae.ufl.edu
Problem uncertainty reduction • From the data on slide 19, estimate the mean and standard deviation of the transverse strain . For that make the assumption that it is normally distributed and that the other failure modes do not contribute to the probability of failure. xueyong@mae.ufl.edu