Modifying Reliability Based Design to Include Durability
Modifying Reliability Based Design to Include Durability. Richard Speckart, Nathan Post, Scott Case, & John Lesko Materials Response Group Dept. of Engineering Science & Mechanics Virginia Tech Blacksburg, VA,USA Paul Hess NAVSEA Carderock Division Bethesda, MD USA.


Modifying Reliability Based Design to Include Durability
E N D
Presentation Transcript
Modifying Reliability Based Design to Include Durability Richard Speckart, Nathan Post, Scott Case, & John Lesko Materials Response Group Dept. of Engineering Science & Mechanics Virginia Tech Blacksburg, VA,USA Paul Hess NAVSEA Carderock Division Bethesda, MD USA MACRO Review, Blacksburg, VA 13-15 September 2004
Hawthorne St. Bridge Tillman Island Troutville Weigh Station Tom’s Creek Bridge Rt. 351 Dickey Creek Bridge Rt. 40 Composite Highway Structures in Virginia How do we design for durability?
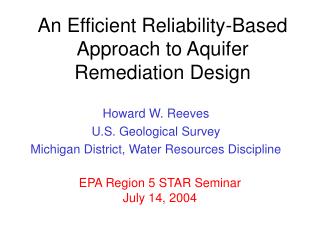
Mast Deck house Hull Questions about durability & variability and how to design given various operational scenarios US Navy Advanced Materials
Objective: Durability + Reliability To develop a Scientific means to calculate knockdown factors, f,given a desired reliability and expected loads • Examine the means to characterize and describe variability in durability • Examine the relationship of path dependence (i.e. the effects of load history on variability) • Examine durability/reliability simulation methods
Residual Resistance years of service Developing Guidance on f Resistance, Resistance, R R Load, Load, Q Q Initial Initial Resistance Resistance Load & Resistance Factor Design (LRFD)
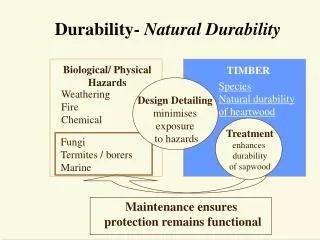
Remaining Strength Of Critical Element - Fr Stress on Critical Element – Fa Estimating Remaining Strength & Stiffness [csm/0/90/csm/±45/csm]s Degradation Processes • Time dependent damage • Kinetic • Chemical • Thermodynamic Geometry Constitutive Initial Strength Stress or Strength Life t Reifsnider et al. (1975- present)
Develop estimate on resistance based on stress analysis/material • Develop load/environment history based on statistical description (Monte Carlo Simulation) Yes No ? Compute f & Pf Life Prediction • Input material characteristics (S-N curve, stiffness and strength reduction as a function of environment -including statistical description) Stress or Strength Life Simulation Approach Loads, Q
Fatigue Variability Investigation • Investigate the variability of E-glass/VE composite fatigue durability • Characterize variability in… • Quasi-static properties • Fatigue Life • Stiffness reduction • Use Residual Strength mechanics to predict remaining strength changes with fatigue damage and it’s variability
Material [csm/0/90/csm/±45/csm]s Nexus 110 - 039, 0.18mm = xCDM 1810 0.74 mm @ 55vol% in the C and D layers and @ 28vol% in the M layer = xDBM 1710 0.74 mm @ 55vol% in the C and D layers and @ 28vol% in the M layer • vf=52% • E-glass/Vinyl Ester • Owens Corning Fabric • Dow Derakane – 640-900 • Pultruded @ Dow Freeport, TX CSM M8643 CSM, Mat 1.0 oz = 0.48 mm @ 28 Vol% glass xDBM 1710 xCDM 1810 Nexus 110 - 039
Data Analysis – Initial Strength, Stiffness & Strain to Failure
m-3s m-2s Fatigue data representation with remaining strength Mean Lifetimes (cycles) 35% = 37400 30% = 128500 25% = 465500 Measure Residual Strength
Stiffness Reduction Error bars represent the 10 and 90th percentile of the data. E-glass/Derakane 640-900 [csm/0/90/csm/±45/csm]s
Normalized Life: 0.01, 0.1, 0.25, 0.5, 0.75, 0.9 Actual Cycles: 100,1000, 5000, 10000, 20000 Representations of dynamic stiffness data
Correlation Analysis of Fatigue Data –30% of Ultimate - Normalized Lifetime Analysis
Correlation Analysis of Fatigue Data – 30% of Ultimate - Actual Lifetime Analysis
Simulation Approach Loading history Random Initial Material Properties (Monte Carlo) Critical Element Load Remaining Strength, Fr For N cycles Material Evolution (Dynamic Stiffness) For i trials Remaining Strength Distribution
Simulation Details • Currently designed for fixed fatigue load level and specified number of cycles – • Random initial properties (strength, stiffness and strain to failure) based on observed correlations • Stiffness reduction correlated to initial stiffness • Fatigue variability fixed for critical element
Simulation Details Remaining strength evolution: numerical integration of: Where,
Simulation Procedure Adjust the rate index ‘j’ and critical element S-N ‘A’ and ‘B’ to match median values of data using least squares fitting of the 3 load levels and 6 remaining strength points: * Note that j is lower than expected (expect j 1.0)
Determining Load on the Critical Element, Fa(n) • Strain based failure criterion simplifies analysis and is based on dynamic composite stiffness • E(n) is modeled using with the fitting parameters a, b and c calculated by least squares fit to all the data for a given load level
Simulation of Remaining Strength Fatigue at 35% of Ultimate m b=47.6 a=38.2 ksi Fatigued to m-3s 17,300 cycles Exp. Sim. b=16.3 11.7 a=23.2 23.5 Fatigued to m-2s 23,800 cycles Exp. Sim. b=20.8 13.6 a=25.9 27.4
Simulation of Remaining Strength Fatigue at 30% of Ultimate m b=47.6 a=38.2 ksi Fatigued to m-3s 45,900 cycles Exp. Sim. b=8.4 11.6 a=23.4 23.2 Fatigued to m-2s 72,900 cycles Exp. Sim. b=14.7 16.6 a=26.1 28.1
Simulation Results • Using 1000 trials to simulate each remaining strength point • Results based on deterministic values of fitting parameters presented above (a) Because only 15 samples were tested at each point, these values are not significant to compare
Summary and Conclusions • Observed correlations between various properties and damage related variability • Reasonable agreement between simulated & measured residual strength distributions for E-glass/VE composites • Simulation for Fa(n) variability • Further study of S-N data variability and inclusion • Future efforts to determine f based on single and combined environments
Acknowledgements • Office of Naval Research, Code 334 • Naval Surface Warfare Center, Carderock Division • The Dow Chemical Comp.
Virginia Tech Campus Questions?