Variance & Standard Deviation
This lecture is organized by Dr. Alemi and narrated by Yara Alemi. The lecture is based on the OpenIntro Statistics book. . Variance & Standard Deviation. By Farrokh Alemi, Ph.D. Variance.

Variance & Standard Deviation
E N D
Presentation Transcript
This lecture is organized by Dr. Alemi and narrated by Yara Alemi. The lecture is based on the OpenIntro Statistics book. Variance & Standard Deviation By Farrokh Alemi, Ph.D.
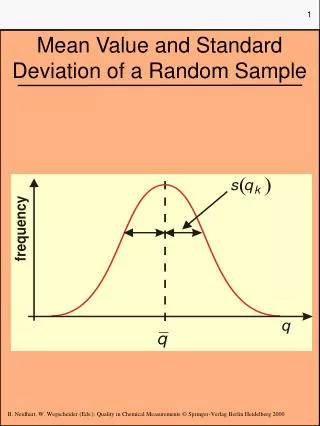
Variance The mean describes the center of data, but the variability in the data is also important. Here we see two sets of data. Both have the same mean. The red data shows a set with tight spread of data around the mean. The green distribution shows a large spread around the mean. We need a measure of how far the data is spread around the mean.
Deviation To measure the spread of data we start with deviation. Deviation is the difference between the ith observation and the mean. Here x is the ith observation and meu is the population mean.
Deviation Distance You can think of deviation as how far off the course we are if we deviate from our main road and end up at the observation point. Observation Mean
Deviation We can deviate to the right of the mean or to the left, so the difference of the mean and observation can be positive or negative. One idea for measuring the spread around the mean is to calculate the sum of deviations for all points in the population. This is problematic. If we just sum the deviations some positive deviations will cancel out other negative deviations and create an image that the spread is less than it is. To avoid this, we first square the deviations and then sum it. Less than Mean More than Mean Observation Mean Observation Mean
Variance The measure of spread calculated in this way is called Variance. It is defined as the average of the square of deviations for every point in the population.
Standard Deviation The standard deviation is the square root of the variance. In this formula x indicates the ith observation and x with a bar on top indicates the mean of the sample. N indicates the number of observations in the sample. As in calculation of variance, we are summing the square of the deviations and not the deviations themselves. The standard deviation is roughly the average of the squared deviations. The standard deviation is useful when considering how close the data are to the mean.
Standard Deviation To calculate the standard deviation, you first calculate the deviations for each point. Here we have three observations, 5, 2 and 5. The mean is 4. The deviation from the mean are 1, minus 2 and 1. Note that the total sum of deviations is 0.
Standard Deviation Once the deviations have been calculated, then you square the deviations. The sum of the squared deviation is 6.
Standard Deviation Last you divide the sum by one minus the number of observations and take the square root of it. The sum is 6, there are 3 observations so the division yields 2 and the square root of 2 is 1.7. This value is referred to as standard deviation.
Standard Deviation Standard deviation is a measure of spread of data around the mean. If the spread is small, then the value of standard deviation will be small. If the spread is large, the value of standard deviation will be large. We now have a measure for describing the spread of data around the mean. Large standard deviation Small standard deviation
Standard Deviation One also expects most data to fall within one standard deviation of the mean. The actual percentage that falls within one or two standard deviation depends on the shape of the distribution. Here we see three different distributions that have the same mean and the same standard deviations. Usually 70% of the data fall within one standard deviation of the mean. 95% of the data fall within 2 standard deviation of mean.
Take Home Lesson Standard Deviation measures the spread of data around the mean
Do One: Calculate the standard deviation for the following three observations: 3, 4 and 5. Let us test your knowledge of standard deviation. See if you can answer this question.