Download
1 / 8
80 likes | 269 Vues
Computing Variance & Standard Deviation Name:_________________ Date:_______. The standard deviation is used to tell how far on average any data point is from the mean. The smaller the standard deviation, the closer the scores are on average to the mean.

E N D
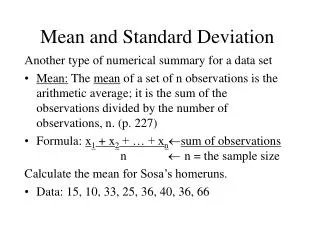
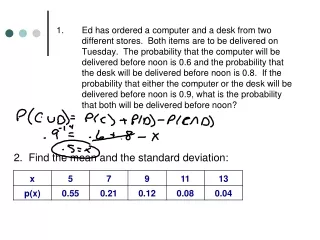
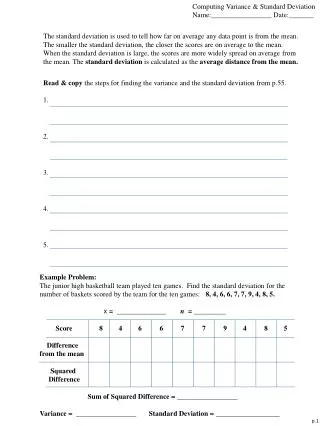
Computing Variance & Standard Deviation Name:_________________ Date:_______ The standard deviation is used to tell how far on average any data point is from the mean. The smaller the standard deviation, the closer the scores are on average to the mean. When the standard deviation is large, the scores are more widely spread on average from the mean. The standard deviation is calculated as the average distance from the mean. Read & copy the steps for finding the variance and the standard deviation from p.55. 1. 2. 3. 4. 5. • Example Problem: • The junior high basketball team played ten games. Find the standard deviation for the number of baskets scored by the team for the ten games: 8, 4, 6, 6, 7, 7, 9, 4, 8, 5. • = ______________ n = _________ • Score 8 4 6 6 7 7 9 4 8 5 • Difference • from the mean • Squared • Difference • Sum of Squared Difference = _________________ • Variance = _________________ Standard Deviation = __________________ p.1
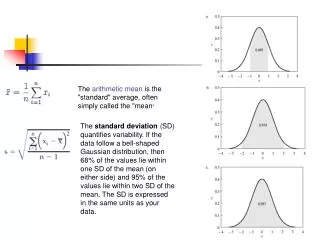
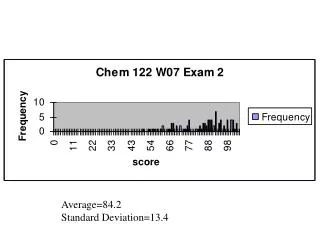
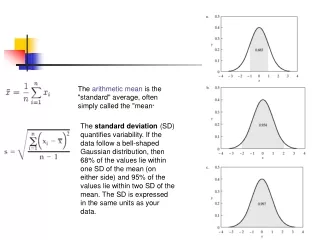
A commonly used measure of dispersion is the standard deviation, which is simply the square root of the variance. The variance of a data set is calculated by taking the arithmetic mean of the squared differences between each value and the mean value. Squaring the difference has at least three advantages: • Squaring makes each term positive so that values above • the mean do not cancel values below the mean. • Squaring adds more weighting to the larger differences, and • in many cases this extra weighting is appropriate since points • further from the mean may be more significant. • The mathematics are relatively manageable when using this measure • in subsequent statistical calculations. • Because the differences are squared, the units of variance are not the same as the units of the data. Therefore, the standard deviation is reported as the square root of the variance and the units then correspond to those of the data set. • Example Problem 2: • The dot frequency distribution at the • right shows the number of days selected • students were absent in a semester. • a. Find the variance and standard deviation of these data by using paper and pencil. • b. Find the variance and standard deviation either by using the statistics • capabilities of your graphing calculator. http://www.quickmba.com/stats/standard-deviation/ p.2
Example Problem 3: • Consider the following two data sets. • {1, 2, 3, 4, 5, 6, 7, 8} {1, 1, 1, 1, 8, 8, 8, 8} • Without using a calculator, tell how the means and the • standard deviations of the two data sets compare. • b. Use a calculator to find the mean and the standard • deviation of each set to check your answer to part a. Wrap Up: 1. Tell whether the statistic may be negative. Write yes or no. a. the mean b. a deviation c. the variance d. the standard deviation . 2. Match each expression with a descriptor of the data set {x1, x2,…, x}. i. Mean ii. Variance iii. Sum of the Deviations iv. Standard Deviation v. Sum of the Deviations Squared p.3
A large standard deviation indicates that the data points are far from the mean and small standard deviation indicates that they are clustered closely around the mean. For example, each of the three populations {0, 0, 14, 14}, {0, 6, 8, 14} and {6, 6, 8, 8} has a mean of 7. Their standard deviations are 7, 5, and 1, respectively. The third population has a much smaller standard deviation than the other two because its values are all close to 7. In a loose sense, the standard deviation tells us how far from the mean the data points tend to be. It will have the same units as the data points themselves. If, for instance, the data set {0, 6, 8, 14} represents the ages of a population of four siblings in years, the standard deviation is 5 years. As another example, the population {1000, 1006, 1008, 1014} may represent the distances traveled by four athletes, measured in meters. It has a mean of 1007 meters, and a standard deviation of 5 meters. Application examples The practical value of understanding the standard deviation of a set of values is in appreciating how much variation there is from the "average" (mean). Climate As a simple example, consider the average daily maximum temperatures for two cities, one inland and one on the coast. It is helpful to understand that the range of daily maximum temperatures for cities near the coast is smaller than for cities inland. Thus, while these two cities may each have the same average maximum temperature, the standard deviation of the daily maximum temperature for the coastal city will be less than that of the inland city as, on any particular day, the actual maximum temperature is more likely to be farther from the average maximum temperature for the inland city than for the coastal one. Sports Another way of seeing it is to consider sports teams. In any set of categories, there will be teams that rate highly at some things and poorly at others. Chances are, the teams that lead in the standings will not show such disparity, but will perform well in most categories. The lower the standard deviation of their ratings in each category, the more balanced and consistent they will tend to be. Whereas, teams with a higher standard deviation will be more unpredictable. For example, a team that is consistently bad in most categories will have a low standard deviation. A team that is consistently good in most categories will also have a low standard deviation. However, a team with a high standard deviation might be the type of team that scores a lot (strong offense) but also concedes a lot (weak defense), or, vice versa, that might have a poor offense but compensates by being difficult to score on. Trying to predict which teams, on any given day, will win, may include looking at the standard deviations of the various team "stats" ratings, in which anomalies can match strengths vs. weaknesses to attempt to understand what factors may prevail as stronger indicators of eventual scoring outcomes. In racing, a driver is timed on successive laps. A driver with a low standard deviation of lap times is more consistent than a driver with a higher standard deviation. This information can be used to help understand where opportunities might be found to reduce lap times. http://en.wikipedia.org/wiki/Standard_deviation p.4
Computing Variance & Standard Deviation Name:_________________ Date:_______ • The following data give the total amount of snowfall, in inches, recorded at New York’s • JFK Airport in the month of January for the years 1965 to 1996. • a. Find the mean and the standard deviation of the snowfall data using a statistics utility. • b. What percent of these data are within1 standard deviation of the mean? • c. The blizzard of January, 1996, which hit the East Coast was one of the worst in history. • How many standard deviations above the mean was the snowfall for January of 1996? p.1
2. Use the following table, which lists the percents of on-time flight arrivals and departures at major U.S. airports in 1994. Find the mean and the standard deviation a. of the first-quarter percents. b. of the third-quarter percents. c. Which set of percents is more variable? Explain why this seems reasonable. p.2
The calculation and notation of the variance and standard deviation depends on whether we are considering the entire population or a sample set. Following the general convention of using Greek characters to express population parameters and Arabic characters to express sample statistics, the notation for standard deviation and variance is as follows: = population standard deviation = population variance s = estimate of population standard deviation based on sampled data s2 = estimate of population variance based on sampled data The population variance is defined as: The variance of a sampled subset of observations is calculated in a similar manner, using the appropriate notation for sample mean and number of observations. However, while the sample mean is an unbiased estimator of the population mean, the same is not true for the sample variance if it is calculated in the same manner as the population variance. If one took all possible samples of n members and calculated the sample variance of each combination using n in the denominator and averaged the results, the value would not be equal to the true value of the population variance; that is, it would be biased. This bias can be corrected by using ( n - 1 ) in the denominator instead of just n, in which case the sample variance becomes an unbiased estimator of the population variance. http://www.quickmba.com/stats/standard-deviation/ STANDARD DEVIATION for a population versus a sample: When a set of data contains all the possible data points for a population the calculation of standard deviation provides a specific value that characterizes that population. Such a specific value for a statistic is called a parameter. However, it is much more likely that the data one is working with is not the complete population, but only a sample. When a sample is used we need to estimate the standard deviation from the sample. In this situation 1 is subtracted from the N number of cases. (See the formulas above) For small samples this N-1 tends to increase the standard deviation slightly, making it a conservative estimate of the population's parameter. As sample size increases the effect of N-1 declines and the results of the two formulas converge towards the population parameter. WHAT DOES STANDARD DEVIATION MEAN? The standard deviation statistic is a number that marks a distance on the measurement scale. In very general terms it is the average difference between each score and the mean average. A standard deviation is central to many of the statistics used to make inferences and test hypotheses. HOW IS STANDARD DEVIATION INTERPRETED? A calculated standard deviation is an estimate of how scores are distributed away from the mean average. If this distribution is approximately normal (bell shaped curve), then .34 (34%) of the cases will occur within one standard deviation. Also, if one adds one standard deviation to the mean and subtracts one standard deviation from the mean the between these two numbers it is estimated that 68% of the cases will occur. This range give a reasonable range to use when discussing where about 2/3rds of the cases will be found. In more advanced interpretations a researcher may use a fraction of the standard deviation and a normal distribution table to estimate a different proportion of the cases. http://www.documentingexcellence.com/stat_tool/SD.htm
Date: 01/31/2006 at 17:01:11 From: Stefan Subject: Standard Deviation In regards to sample vs. population standard deviation, why is (n-1) used in the denominator rather than n? Date: 02/01/2006 at 00:52:14 From: Doctor Wilko Subject: Re: Standard Deviation Hi Stefan, Thanks for writing to Dr. Math! The answer would be found in any graduate-level book on probability. You would have to look up topics on biased/unbiased estimators. The first question for us to answer is "What's an estimator?". Definition: An estimator is a rule/formula that tells us how to calculate the value of an estimate based on the measurements contained in the sample. Let's think about this using means (averages). For example, if we take a random sample of 20 test scores from a class of 35 students, we can try to estimate the entire class average (population mean) by calculating the sample mean from these 20 scores. This sample mean is an estimator of the true population mean. The rule/formula in this example is to take the 20 scores, add them up, and divide by 20. The answer we get, the sample mean, is an estimator--our best inference about the true population mean (which we don't know, that's why we're trying to estimate it). Now that we know what an estimator is, the short answer to your question is that sample variance (an estimator) COULD'VE been defined as "the sum of the squares of each value minus the sample mean divided by n", but it turns out that this is a BIASED estimator. So, what's a biased estimator? A biased estimator in this case means that the sample variance calculated this way (divided by n) underestimates the true population variance. If we are trying to make an inference about the true population variance, we don't want to underestimate, we want to be as accurate as we can! So, using some theory from probability, it can be shown that this biased sample variance as defined by dividing by n) can be made UNBIASED by dividing by (n-1) instead. So, that's the reason we divide by (n-1)--to get an unbiased estimator. Now we have a good estimator that we can use when making inferences about a population! Does this help? Please write back if you have further questions. - Doctor Wilko, The Math Forum http://mathforum.org/dr.math/ http://mathforum.org/library/drmath/view/68623.html