Download

1 / 17
170 likes | 217 Vues
Explore the significance of mean and standard deviation in data analysis, learn data mining techniques with pivot tables, and delve deeper into understanding data beyond surface levels. Discover how to create, customize, and analyze pivot table reports to extract valuable insights from your data effectively.

E N D
Beyond mean and standard Deviation… AMTRA Presentation – 3/14/09 Presented by:Anne Geraci
Course contents • What do the mean & standard deviation tell us? • Overview: Pivot tables • Lesson: Mining for data! • Lesson: Grouping & Advanced Techniques Get started with PivotTable reports
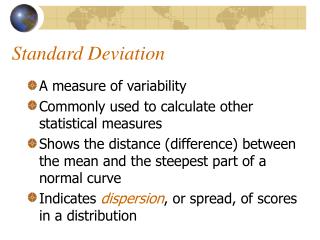
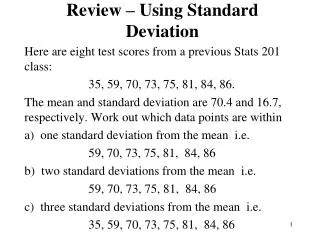
Mean … but what does this mean?
… but what does this mean? • The “typical” age of the individuals in this sample is 51.2 years old. • The youngest person is 37. • The oldest person is 61. • The “average” deviation from 51.2 was 9.2 years. • By the empirical rule, 68% of people in this sample (or in the represented population) will be within 9.2 years (1 standard deviation) of 51.2, a range of 42 to 60 years old.
To get a better understanding of the data, we need to look beyond just the surface … • Is there a difference in age between a “typical” female and a “typical” male? • What about the color of the car that people drive? Are older people more likely to drive a certain color car?
overview What’s a pivot table?
What’s a pivot table? Get started with PivotTable reports
What’s a pivot table? COLUMNVARIABLE ROWVARIABLE Get started with PivotTable reports
What’s a pivot table? DATA SUMMARIZEDDATA Get started with PivotTable reports
What’s a pivot table? ROW & COLUMN TOTALS Get started with PivotTable reports
Step 1. Prepare your data • Each column = 1 field • Field Name in Row 1 • No blank rows or columns • All data in one column must be similar (numeric or text) Get started with PivotTable reports
Step 2. Create PivotTable Excel 2007 – Insert tab, Tables group, click PivotTable, then PivotTable again For Excel 2003, click on Data, then PivotTable Get started with PivotTable reports
Step 2. Create PivotTable … select the range for your data and click OK. Get started with PivotTable reports
Step 3. Select fields Get started with PivotTable reports
Let’s try it! Get started with PivotTable reports