Mean, Median, Mode Variance Standard Deviation
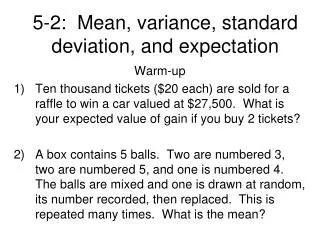
780 likes | 3.32k Vues
Mean, Median, Mode Variance Standard Deviation. Bozeman Biology videos: Statistics for Science Standard Deviation Standard Error. Science Practice 2: The student can use mathematics appropriately. Modified from: Mathisfun.com http://www.mathsisfun.com/data/standard-deviation.html.

Mean, Median, Mode Variance Standard Deviation
E N D
Presentation Transcript
Mean, Median, ModeVarianceStandard Deviation Bozeman Biology videos: Statistics for Science Standard DeviationStandard Error Science Practice 2: The student can use mathematics appropriately Modified from: Mathisfun.com http://www.mathsisfun.com/data/standard-deviation.html
A sample of dogs was measured The heights (at the shoulders) are: 600mm, 470mm, 170mm, 430mm and 300mm. Image from: http://www.mathsisfun.com/data/standard-deviation.html
FIND the RANGE Smallest number - largest number 170 mm – 600 mm The heights (at the shoulders) are: 600mm, 470mm, 170mm, 430mm and 300mm. Image from: http://www.mathsisfun.com/data/standard-deviation.html
Find the MEAN MEAN ( ): average of all data points Mean height is 394 mm Image from: http://www.mathsisfun.com/data/standard-deviation.html
FIND the MEDIAN The heights (at the shoulders) are: 600mm, 470mm, 170mm, 430mm and 300mm. . Image from: http://www.mathsisfun.com/data/standard-deviation.html
MEDIAN: Data point that is found in the middle when all the measurements are lined up from in order from high to low(or an average of middle two values if there is an even number of data points 170mm 300mm 430mm 470 mm 600mm .
FIND the MODE The heights (at the shoulders) are: 600mm, 470mm, 170mm, 430mm and 300mm. . Image from: http://www.mathsisfun.com/data/standard-deviation.html
MODE: Most common data point 170mm 300mm 430mm 470 mm 600mm There is no mode for these data
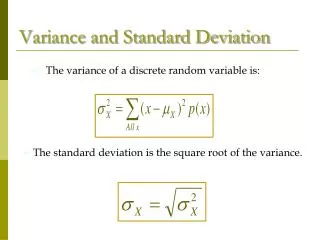
The heights (at the shoulders) are: 600mm, 470mm, 170mm, 430mm and 300mm. Determine the VARIANCE.How far is each measurement away from the mean? Image from: http://www.mathsisfun.com/data/standard-deviation.html
VARIANCE (= s2) s2 =(600 – 394)2 + ( 470- 394) 2 + ( 170- 394)2 + ( 430-394)2 +( 470- 394) 2 5-1 s2 =206 2 + 76 2 + (-224)2 + 36 2 + (-94) 2 4 s2 = http://www.mathsisfun.com/data/standard-deviation.html
Does the mutagen have an impact on mean tail length ( ) in Musmusculus? • A group of mice was fed a diet with a mutagen that was thought to affect tail length in mice added. • Another group of mice was fed the same diet w/o the mutagen added. • HO ? Mutagen mice idea from Kristen DottiCatalyst Learning Curriculum Image from: http://www.petdiscounters.com/assets/images/product_images/image/d_4491.jpg
MEASURING MICE • Determine the tail lengths of the mice in the sample provided to your group. • Determine RANGE, MEAN, MEDIAN, MODE, & VARIANCE for the mice in your sample. • Post your measurements on class data chart Image from: http://www.petdiscounters.com/assets/images/product_images/image/d_4491.jpg
STANDARD DEVIATION(s) Watch Bozeman Biology video Standard Deviation= square root of Variance σ = √21,704 = 147.32... = 147mm Standard Deviation is useful. Now we can show which heights are within one Standard Deviation (147mm) of the Mean: Rottweilersare tall dogs and Dachshunds are a bit short Image from: http://www.mathsisfun.com/data/standard-deviation.html
STANDARD DEVIATIONthe standard deviation of the sample is the degree to which individuals within the sample differ from the sample mean. STANDARD ERROR OF THE MEAN thestandard errorof the mean is an estimate of how far the sample mean is likely to be from the population mean Bozeman Biology Standard Error
In a normal distribution68.2% within 1 standard deviation from mean95.4% within 2 standard deviations from mean99.7% within 3 standard deviations from mean http://www.strath.ac.uk/media/faculties/hass/appliededucationalresearch/mod4unit3/curve1.jpg