Average, Median, and Standard Deviation
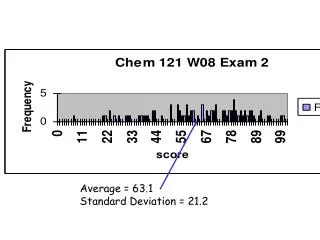
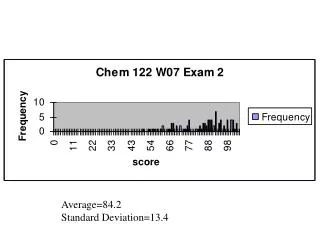
Average, Median, and Standard Deviation. Center and Spread. The average and the median are measures of the center . The standard deviation is a measure of the spread. Center and Spread. The centers of the two histograms are the same, but the histogram on the right is more spread out.

Average, Median, and Standard Deviation
E N D
Presentation Transcript
Center and Spread • The average and the median are measures of the center. • The standard deviation is a measure of the spread.
Center and Spread The centers of the two histograms are the same, but the histogram on the right is more spread out.
Average, Mean, Median • The average of a list of numbers equals their sum, divided by how many there are. • The average is sometimes called the (arithmetic) mean.
The Median • The median of a list is the value with half the entries to the left, and half the entries to the right. • Find the median of 9, 1, 2, 2, 0: Order the list: 0, 1, 2, 2, 9 • Find the median of 7, 2, 1, 5: Order the list: 1, 2, 5, 7. The average of 2 and 5 is 3.5
Average vs. Median Income • For persons age 25 and over in the U.S. would the average or the median be higher for income? For years of schooling completed?
The Tail of a Histogram Average is bigger than the median Average is about the same as the median Average is smaller than the median
Standard Deviation The standard deviation tries to quantify the spread.
The root-mean-square • The average of the list 0, 5, -8, 7, -3 is 0.2. • The positive numbers ‘wipe out’ the negative ones. • We could neglect the signs. The average of 0, 5, 8, 7, 3 is 4.6 • Instead, we use the root-mean-square.
The root-mean-square • Square all the entries. This will get rid of all the signs. • Take the mean (average) of the squares. • Take the square root of the mean.
Example • Find the root-mean-square of 0, 5, -8, 7, -3. • Square: 0, 25, 64, 49, 9. • Mean: (0 + 25 + 64 + 49 + 9) : 5 = 29.4 • Root:
Computing the Standard Deviation Find the standard deviation of 20, 10, 15, 15. • Find the average: 15. • Find the deviations from the average: 5, -5, 0, 0. • Find the root-mean-average:
Which list has the larger SD? • 50, 40, 60, 30, 70, 25, 75 • 50, 40, 60, 30, 70, 25, 75, 50, 50, 50
68 – 95 - 99 • In many cases, roughly 68 percent of the entries on a list are within 1 SD of average; roughly 95% within 2 SDs; 99 percent are within 3 SDs of the average.
Example • Average height for boys age 11 is 146 cm and the SD was 8 cm. • How much below average is a boy 170 cm tall? 148 cm tall? • How tall is a boy 1.5 SD below average? • Four boys are 150 cm, 130 cm, 165 cm, 140 cm. Who is unusually short, about average, unusually tall?