Download
1 / 25
280 likes | 579 Vues
Confidence Intervals for Variance and Standard Deviation. Chi-square Distributions. As sample size increases and d.f. increases, the distribution for a chi-square becomes flatter. Chi-square distributions are positively skewed.

E N D
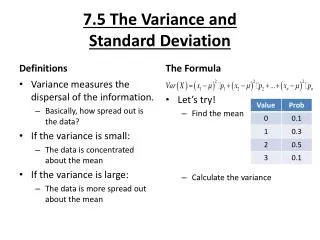
Chi-square Distributions As sample size increases and d.f. increases, the distribution for a chi-square becomes flatter. Chi-square distributions are positively skewed.
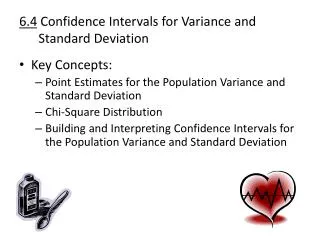
You can use a chi-square distribution to construct a confidence interval for the variance and standard deviation.
Critical Values • There are two critical values for each level of confidence. The value of represents the right-tail critical value and repesents the left-tail critical value. Chi-square table lists critical values of X2 for various degrees of freedom and areas. Each area in the table represents the region under the chi-square curve to the RIGHT of the critical value.
Ex. 1: Finding Critical Values for X2 • Find the critical values, and , for a 90% confidence interval when the sample size is 20.
SOLUTION • Because the sample size is 20, there are d.f.= n – 1 = 20 – 1 = 19 degrees of freedom. The areas to the right of and are: Area to right of Area to left of
Using d.f. = 19 and the areas 0.95 and 0.05, you can find the critical values, as shown by the highlighted areas in the table. From the table, you c an see that and So, 90% of the area under the curve lies between 10.117 and 30.144.
Confidence Intervals • You can use the critical values and to construct confidence intervals for a population variance and standard deviation. As you would expect, the best point estimate for the variance is s2 and the best point estimate for the standard deviation is s.
Ex. 2: Constructing a Confidence Interval • You randomly select and weigh 30 samples of an allergy medication. The sample standard deviation is 1.2 milligrams. Assuming the weights are normally distributed, construct 99% confidence intervals for the population variance and standard deviation.
SOLUTION • The areas to the right of and are: Area to the right of Area to the left of Using the values n = 30, d.f. = 29 and c = 0.99, the critical values for and are:
Using these critical values and s = 1.2, the confidence interval for 2 is as follows:
Solution: • The confidence interval for is : So, with 99% confidence, you can say that the population variance is between .798 and 3.183. The population standard deviation is between 0.89 and 1.78 milligrams.
Confidence Intervals for the Difference between Two Population Means µx - µy
Confidence Intervals for the Difference between Two Population Means • An important problem in statistical inference deals with the comparison of two population means. To compare population means, a random sample is drawn from the two populations and an inference about the difference between population means is based on the sample results. We will consider the following two very common sampling schemes; • Matched Pairs • Independent Samples
Confidence Intervals for the Difference between Two Population Means: Matched Pairs • In this scheme, the sample members are choosen in pairs, one from each population. The idea is that, apart from the factor under study, the members of these pairs should resemble one another as closely as possible so that the comparison of interest can be made directly. For instance, suppose that we want to measure the effectiveness of a speed- reading course. One possible approach would be to record the number of words per minute read by a sample of students before taking the course and compare with results for the same students after completing the course. In this case, each pair of observations consists of ‘before’ and ‘after’measurements on a single student.
Confidence Intervals for the Difference between Two Population Means: Matched Pairs • Thesamplemeanandthevariance of thedifference; • Ifthepopulationdistribution of thedifferences is assumedto be normal, then a confidenceintervalfor is givenby
Confidence Intervals for the Difference between Two Population Means µx - µy: Independent Samples • As a first step, we examine the situation where the two population distributions are normal with normal variances. The random variable, the difference between the corresponding sample means has mean; • And since the samples are independent, variance
Confidence Intervals for the Difference between Two Population Means µx - µy: Independent Samples • Therandomvariable has a standart normal distribution.
Confidence Intervals for the Difference between Two Population Means µx - µy: Independent Samples (Known Variances or Large Sample Sizes) Suppose that we have independent random samples of and observations from normal distributions with means . and and variances and . If the observed sample means are and then a confidence interval for is given by
Confidence Intervals for the Difference between Two Population Means µx - µy: Independent Samples , Population Variances Equal • Commonvariance; • Theestimatorused is
Confidence Intervals for the Difference between Two Population Means µx - µy: Independent Samples, PopulationVariancesEqual • Replacing the unknown variance with its estimator; • This random variable obeys the Student’s t distribution with ( ) degrees of freedom.
Confidence Intervals for the Difference between Two Population Means µx - µy: Independent Samples , PopulationVariancesEqual Suppose that we have independent random samples of and observations from normal distributions with means . and and a common variance. If the observed sample means are and then a confidence interval for is given by