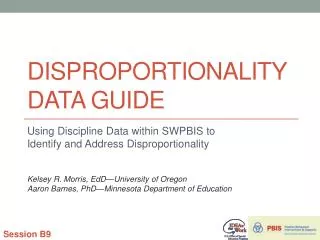
Disproportionality Data Guide
Disproportionality Data Guide. Using Discipline Data within SWPBIS to Identify and Address Disproportionality. Kelsey R. Morris, EdD —University of Oregon Aaron Barnes, PhD—Minnesota Department of Education. Session B9. Purpose Describe a framework and steps for:

Disproportionality Data Guide
E N D
Presentation Transcript
Disproportionality Data Guide Using Discipline Data within SWPBIS to Identify and Address Disproportionality Kelsey R. Morris, EdD—University of Oregon Aaron Barnes, PhD—Minnesota Department of Education Session B9
Purpose • Describe a framework and steps for: • Identifying levels of disproportionality • Analyzing data to determine solutions • Monitoring effectiveness of action plans in addressing disproportionality • Audience • School/District teams seeking to reduce racial and ethnic disproportionality in school discipline
Maximizing Your Session Participation • Where are you in your implementation of the concepts presented? • Exploration & Adoption • Installation • Initial Implementation • Full Implementation • What do you hope to learn? • What new learning do you take away from the session? • What will you do with your new learning?
Background • Racial and ethnic discipline disproportionality is both long-standing and widespread. • In 1973 African American students almost twice as likely to be suspended than white peers. By 2006, more than three times more likely (Losen & Skiba, 2010). • African American students risk suspension for minor misbehavior and suspension/expulsion for same behavior as other students from other racial/ethnic groups (Skiba et al., 2011).
Moving Forward • Educators must address this issue • Identify rates of discipline disproportionality • Take active measure to reduce it • Monitor the effects of interventions on disproportionality • Rigorous collection and analysis of data aids: • Understanding the need for change • Identifying areas for improvement • Determining appropriate action • Ensure that efforts to reduce disproportionality are effective • Guide necessary system adjustments
Data Sources • Required features: • Consistent entry of ODR data and student race/ethnicity • School enrollment by race/ethnicity • Instantaneous access for school teams (not just district teams) • Capability to disaggregate ODRS and patterns by race/ethnicity • Capability to calculate risk indices and risk ratios by race/ethnicity
Data Sources • Recommended features: • Standardized ODR forms and data entry • ODR forms with a range of fields (e.g., location, time of day, consequence) • Clear operational definitions of problem behaviors • Clear guidance in discipline procedures (e.g., office vs. classroom managed) • Instantaneous graphing capability • Capability to disaggregate graphs by race/ethnicity • Automatic calculation of disproportionality graphs, risk indices, and risk ratios
Is there a problem? Why is it happening? Is the plan working? What should be done?
Step 1: Problem Identification • Is there a problem? • Identify the difference between what is currently observed (performance) and what is expected our desired (goals). • Example: • 62% of students have 0-1 ODRs • 80% is the goal • Problem is identified with 18% difference between what is observed and what is expected. • Defining the problem with objective measures makes the process more effective and allows accountability for improvement. • Requires multiple metrics
Step 1: Problem Identification • Risk Index • Percent of a group that receives a particular outcome • Equivalent to the likelihood of someone from that group receiving that outcome • Necessary to calculate and compare risk indices for each racial/ethnic group # of students with 1+ ODRs # of Latino/a students with 1+ ODRs # of White students with 1+ ODRs # of students in the group # of Latino/a enrolled # of White enrolled
Step 1: Problem Identification • Risk Ratio • Represent the likelihood of the outcome (e.g., ODRs) for one group in relation to a comparison group. • Comparison group most commonly used is White students • Risk index for all other groups is sometimes used • Risk Ratio = 1.0 is indicative of equal risk • Risk Ratio > 1.0 is indicative of overrepresentation • Risk Ratio < 1.0 is indicative of underrepresentation Risk Index of Target Group Risk Index of Latino Students .82 Risk Index of Comparison Group Risk Index of White Students .65 = 1.27
Step 1: Problem Identification • Composition • Comparison of the proportion of students within a racial/ethnic group to the proportion of ODRs from the same group • Allows for evaluation of whether the number of ODRs from one group is proportionate to the group’s size
Step 1: Problem Identification • Regardless of the specific discipline data system, the following general steps are used: • Select metrics to use • Risk ratios and composition reports are recommended • Calculate metrics • Compare to goals • Previous years from same school • Local or national norms • 2011-2012 U.S. public schools using SWIS with at least 10 African American and 10 White students • Median risk ratio (African American to White) = 1.84; 25th percentile = 1.38 • Logical criteria • U.S. Equal Employment Opportunity Commission (EEOC) • Disparate impact criterion • Goal risk ratio range between .80 and 1.25
Step 2: Problem Analysis • Why is it happening? • By finding the specific cause of the problem, teams can identify more effective solutions. • Focus: identifying variables that can be changed, not individual traits or variables that are beyond the control of the system • Key: is the disproportionality identified in Step 1 consistent across all situations or more pronounced in some situations? • Disproportionality across all settings indicates explicit bias • Disproportionality in specific settings indicates implicit bias
Step 2: Problem Analysis • Vulnerable Decision Points (VDPs) • Whatproblem behaviors are associated with disproportionate discipline? • Whereis there disproportionate discipline? • Whenis there disproportionate discipline? • Times of day, days of the week, months of the year • What motivations are associated with disproportionate discipline? • Perceived function of problem behavior • Whois issuing disproportionate discipline? • Disparities do not indicate racism, but rather contexts where additional supports are necessary.
Step 2: Problem Analysis • The following steps can be used: • Assess PBIS fidelity • Identify vulnerable decision points (VDPs) • Assess achievement gap Identified Subgroup Location Time of Day Problem Behavior Motivation • Remove all filters and include all subgroups to confirm whether this statement is unique to this subgroup. • African American students are receiving ODRs in the hallways after 2:30 PM for disrespect and the behavior is maintained by peer attention
Step 3: Plan Implementation • What should be done? • Plan Implementation includes: • Selecting and then • Implementing strategies that are most likely to be effective in solving the problem • Visit the National PBIS Technical Assistance Center for recommendations on reducing disproportionality.
Step 3: Plan Implementation • One or more of the following may be targeted: • Inadequate PBIS implementation • Implement core features of PBIS to establish a foundation of support • Misunderstanding of school-wide expectations • Implement culturally-responsive PBIS with input from the students/families • Academic achievement gap • Disproportionality across all settings (indicating explicit bias) • Enact strong anti-discrimination policies that include accountability • Disproportionality in specific settings (indicating implicit bias) • Investigate vulnerable decision points • Lack of student engagement • Use culturally-responsive pedagogy
Step 4: Plan Evaluation • Is the plan working? • Collect short-term (i.e., progress monitoring data) to determine whether solution strategies are being implemented and are effective. • Engage in periodic data collection and meetings (e.g., monthly or quarterly) so that the plan can be changed based on the results. • Calculate the metrics chosen in Problem Identification on a regular basis and review them for progress. • Risk indices are not recommended as they will continue to rise throughout the year. • Risk ratios are recommended because they remain more consistent.
Step 4: Plan Evaluation • Regardless of the specific data system or time, the following general steps are used: • Identify the time periods for evaluating disproportionality data • Assess progress and fidelity of solution plan implementation • Calculate metrics from Step 1: Problem Identification • Compare to the goal determined in Step 1: Problem Identification • Share results with relevant stakeholders
Is there a problem? Why is it happening? Is the plan working? What should be done?
Disproportionality Data Guide Using Discipline Data within SWPBIS to Identify and Address Disproportionality Kelsey R. Morris, EdD—University of Oregon Aaron Barnes, PhD—Minnesota Department of Education Session B9