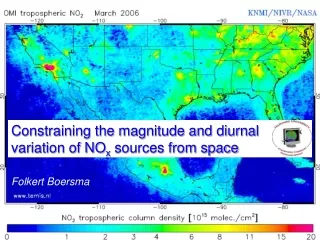
Folkert Boersma
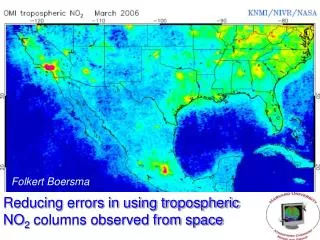
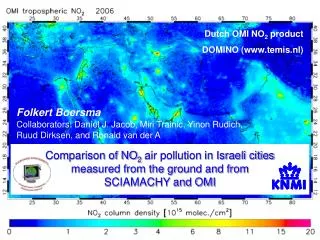
Dutch OMI NO 2 product DOMINO (www.temis.nl). Folkert Boersma. Collaborators: Daniel J. Jacob, Miri Trainic, Yinon Rudich, Ruud Dirksen, and Ronald van der A. Comparison of NO 2 air pollution in Israeli cities measured from the ground and from SCIAMACHY and OMI. Motivation.

Folkert Boersma
E N D
Presentation Transcript
Dutch OMI NO2 product DOMINO (www.temis.nl) Folkert Boersma Collaborators: Daniel J. Jacob, Miri Trainic, Yinon Rudich, Ruud Dirksen, and Ronald van der A Comparison of NO2 air pollution in Israeli cities measured from the ground and from SCIAMACHY and OMI
Motivation • Trends in emissions • Can we use satellite measurements of NO2 to obtain better estimates of NOx emissions? • Monitoring of a target polluter • Is tropospheric NO2 a proxy for near-surface NO2? Boersma et al., Atmos. Environ., 2008
Comparison of surface and satellite NO2 • Different quantities and error budgets: • near-surface concentrations vs. trop. columns • point measurements vs. spatial average • interference from NOz vs. AMF errors • BUT: • Validation still sparse, especially on larger spatial and longer temporal scales • Allows for validation of diurnal cycle Schaub et al., ACP, 2006 • Interference • Ground-based instruments with molybdenum converter overestimate NO2 • Interference from HNO3, PAN, alkyl nitrates • Effect largest in summer (photochemistry) for regions downwind of sources
8 urban stations in Israel • Half-hourly NO2 & O3 concentrations • Molybdenum converters
Known issues with in situ NO2 Dunlea et al., (ACP, 2007) Summarize Dunlea et al.
What does this mean for urban, in situ NO2 ? • Very little interference at 10:00 (fresh emissions, little photochemical processing yet) • Interference modest at 13:30 • Interference correlates with ambient O3 concentration, but O3 itself does not represent an interference slope = 0.1 Israeli cities: no specific NO2 measurements available, but we have in-situ observed O3
Interference correction based on in situ O3 slope = 0.10 • O3 = O3[13:30] – O3[10:00] • Dunlea et al.: interference = 0.1 O3 • Two limiting cases: • no correction at all • correcting NO2 at 13:45 as follows: slope = 0.09 slope = 0.24
Δlat,lon < 0.1° OMI VZA < 35° fclrad < 50%
r = 0.61 (n=396) RMA: y = -1.28 + 0.90x Δlat,lon < 0.1° OMI VZA < 35° fclrad < 50% No correction
r = 0.54 (n=396) RMA: y = -0.68 + 0.92x Δlat,lon < 0.1° OMI VZA < 35° fclrad < 50% No correction Uniform correction (-8%)
Boundary-layer columns from surface NO2 z (m) 1091 DJF • Assume well-mixed boundary-layer • Extrapolate surface NO2 throughout the BL depth • Seasonal variation in noontime BL depths over Israel from Dayan et al. [1988, 2002] MAM, SON 790 JJA 608 NO2 (ppb) Summertime subtropical high is associated with subsidence of FT air, “capping” the BL.
Boundary-layer columns from surface NO2 Surface – OMI vs. BL column - OMI No correction No correction Column-column comparison No interference correction: y = -0.86 + 0.90 x Interference correction: y = -0.35 + 0.94 x
Weekly cycle in surface and OMI NO2 columns Beirle et al. (ACP, 2004)
Diurnal cycle in NO2 columns? NO2 NO2 : NOx E k NO2+OH+M HNO3+M Boersma et al., JGR, 2008
Diurnal cycle in surface-based and satellite NO2 n = 26 Δlat,lon < 0.1° fclrad < 50%
Dutch OMI NO2 product DOMINO (www.temis.nl) END
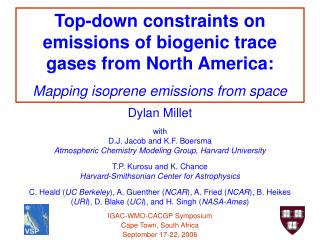
NOx emission inventories in need of verification • New set of emission inventories • EDGAR (global) • Streets et al. 2006 • EMEP (Europe) Lin Zhang et al. (2008) EMEP (1996-2005) GOME, SCIAMACHY (1996-2005) Konovalov et al., ACPD, 2008
NOx emissions show trends in the Middle East • Trend 1996-2006 from GOME, SCIAMACHY • Figure 1996-2006 Cairo + 1.3%/yr Tehran + 6.1%/yr Calcutta + 2.2%/yr Delhi + 7.4%/yr
NOx emissions show trends in the Middle East Richter et al., 2005 van der A et al., 2008 1996-2002 1996-2006
Effect of averaging kernel a: scattering weights xTM4: TM4 NO2 profile b: forward model parameters GEOS-Chem direct GEOS-Chem with AK MI
GEOS-Chem with AK OMI Effect of averaging kernel GEOS-Chem direct NGC = ∑xGC,l NGC,AK = ∑Al·xGC,l NOMI = ∑Al·xtrue,l
Effect of averaging kernel GEOS-Chem direct GEOS-Chem with AK GEOS-Chem direct r (gc,omi) = 0.71 r (gc_ak,omi) = 0.75 Ngc = 0.87 Ngc_ak = 0.93 (+7%) Nomi = 1.09 OMI
What does NGC,AK > NGC mean? Write NGC,AK > NGC differently: Definition of tropospheric air mass factor: Substitute tropospheric air mass factor: Or ( SGC = scatt. weights · GEOS-Chem NO2 profile ):
What does NGC,AK > NGC mean? Mean NO2 profiles over Middle East for 1-7 February 2006 from TM4 and GEOS-Chem
Correcting for background NO2 Can we simply subtract UT NO2 at mid-latitudes? Rynda Hudman et al., JGR, 2007 Randall Martin, 2006 Lin Zhang et al., 2008
Qinbin paper • Duncan paper
Comparison of ground-based to GOME NO2 • Ordonez et al. (ACP, 2006) • Compares 7 years of data over Po Valley to GOME NO2 • Regional comparison (~10.000 km2) • Struggles with interference for ground-based stations
Comparison of ground-based to SCIAMACHY NO2 • Blond et al. (2006) • Compares 1 year of data over northwestern Europe to SCIAMACHY NO2 • Regional comparison (1.800 km2) • No interference correction for ground-based stations • Best agreement for rural stations Annual mean 2003 All stations Rural stations Differences attributed to (lack of) spatial representativity of stations
Boundary-layer columns from surface NO2 Surface – SCIAMACHY vs. BL column - SCIAMACHY Δlat,lon < 0.25° n = 135 No correction No correction y = -0.35 + 0.70 x If Δlat,lon < 0.1° as for OMI: r = 0.65, n = 32 y = -0.47 + 0.93x y = -0.32 + 0.82 x