Download
1 / 11
120 likes | 240 Vues
This report provides a detailed analysis of temperature readings and overall cooling capacities across multiple Air Handling Units (AHUs) post-performance testing. Significant improvements were noted in heat transfer capabilities, with cooling capacity gains of up to 530,815 BTUH. Additionally, the close correlation between pre- and post-test dry and wet bulb temperatures suggests that the averaging method is effective for evaluating energy savings. The report also outlines changes in airflow (CFM) and static pressure, contributing to enhanced overall system performance and efficiency.

E N D
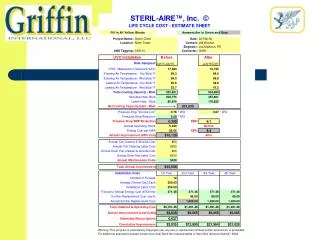
AHU-10 Notes: • Dry bulb (before) and dry bulb (after) temperatures are almost identical, within 5/100th’s of each other. • Wet bulb (before) and wet bulb (after) temperatures are almost identical, within 79/100th’s of each other. • We see substantial improvement in heat transfer ability of the coil, as indicated by the Life Cycle Cost Estimate Sheet with a net cooling capacity gain of 201,033 BTUH. • The fact that the dry bulb and wet bulb temperatures before and after are so close bodes well for using this averaging method as a safe way to determine savings. • We see a decrease in CFM from 17,084 to 16,735 (a 2.1% decrease). We also see a corresponding 9/100th of an inch decrease in static pressure across the coil, primarily attributed to the elimination of the bio-film and increased latent heat transfer.
AHU-27 Notes • Dry bulb (before) and dry bulb (after) temperatures are almost identical, within 83/100th’s of each other. • Wet bulb (before) and wet bulb (after) temperatures are almost identical, within 1.58ºF of each other with the (after) being a more severe condition. • We see substantial improvement in heat transfer ability of the coil, as indicated by the Life Cycle Cost Estimate Sheet with a net cooling capacity gain of 295,079 BTUH. • The fact that the dry bulb and wet bulb temperatures before and after are so close bodes well for using this averaging method as a safe way to determine savings. • We see a slight increase in CFM from 22,646 to 22,744, (0.005% increase). However, we see a .2” inch decrease in static pressure across the coil, primarily attributed to the elimination of the bio-film and increased latent heat transfer while maintaining a constant CFM.
AHU-27 Notes continued: • The (after) OSAH is higher by 8.00% which correlates to more severe average wet bulb condition during the (after) readings. • Amperage has only increased by an average of 1.48 amps . and Hertz has only increased by 2.92Hz which may correlated to the more severe wet bulb climate we incurred during the (after data) collection causing greater latent capacity and moisture removal at the coil. It could also be partially contributed to filter loading and changing cycles.
AHU-1 Notes • Dry bulb (before) and dry bulb (after) temperatures are almost identical, within 18/100th’s of each other. • Wet bulb (before) and wet bulb (after) temperatures are almost identical, within 72/100th’s of each other. • We see substantial improvement in heat transfer ability of the coil, as indicated by the Life Cycle Cost Estimate Sheet with a net cooling capacity gain of 530,815 BTUH. • The fact that the dry bulb and wet bulb temperatures before and after are so close bodes well for using this averaging method as safe way to determine savings. • We see an increase in CFM from 28,465 to 30,684, (a 7.3% increase). We also see a corresponding 6/100th of an inch increase in static pressure across the coil, primarily attributed to the elimination of the bio-film and increased latent heat transfer.
AHU-1 Notes continued: • We see a (before) chilled water Delta T of 8.54ºF and an (after) chilled water Delta T of 11.73ºF which is a 27.2% increase. • We see a cooler supply air temperature (after) of 57.29ºF vs. the (before) average of 58.85ºF. • The (after) OSAH is higher by 3.67% which correlates to more severe average wet bulb condition during the (after) readings. • Amperage has only increased by an average of 1.35 amps . And Hertz has only increased by 1.5Hz which may correlated to the 7.3% increase in CFM and 6/100th’s of an inch increase in static pressure across coil.