Download
1 / 5
50 likes | 72 Vues
This summary explores the minimum and desired requirements for structural variables needed to support biodiversity and habitat, focusing on the capabilities of radar and LiDAR technology. It also highlights the major issues to be resolved and suggests studies to address them.

E N D
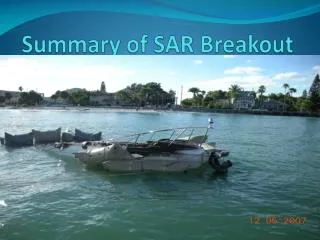
Breakout III Summary Biodiversity and Habitats Marc Imhoff and Ross Nelson - Co-Chairs (Kathleen Bergen and Scott Goetz - Co-Chairs of Breakout I)
1. What are the minimum (m) and desired (d) requirements for structural variablesneeded to support biodiversity/habitat? (single pulse/pixel, assume 25m LiDAR footprints. Radar config. Uncertain) Current State of our Understanding of Tech. Capabilities variables of interestRaDARLiDARaccuracy % crown closure ? yes † 10-20% M, 5% D % understory crown closure (1-3 m?) ? ? study (key var) % midstory crown closure (3-10 m?) ? yes † study (unk) tag dry biomass yes yes † same as Carbon vertical diversity (waveform complexity/entropy) ? yes e.g., decile heights (10% energy levels) no (?) yes 1 m LiDAR bins decile canopy density no (?) yes † HOME or canopy height yes ‡ yes 2 m M, 1 m D maximum canopy height ? yes ditto dbh no no ±20% stem density no no ±20% species no physiognomy (e.g., hardwood,conifer) yes no (?) snags,standing dead wood no no † Will be impacted adversely by slopes, because you need to identify ground return energy to get cc. ‡ Assuming short-repeat (e.g., 4-8 day), non-zero baseline orbits to improve coherence to enable interferometry. M=minimum, D=desired Note: Satellite LiDAR estimates of height, biomass, can be adjusted using, for instance, SRTM “topography” (±60° lat), but it is imperative that techniques be developed to deconvolve topography and canopy signals based only on waveform response.
Q1. Continued: Landscape-level variables Consider multiple profiling LiDAR shots, wall-to-wall L-band RaDAR variables of interestRaDARLiDARaccuracy Canopy roughness (e.g., SD of heights) yes ‡ yes ±20 M,±10% D Surface roughness (topographic variab.) yes yes ditto (study) Identification of edge yes yes Patchiness (within constraints of pixel size) yes yes grain size: 30 meters 20 meters better Landscape metrics (e.g., FRAGSTAT) ditto Size class distribution no (?) no ±20% Slope (of patches - solar relative) ? ? +/- 2% Aspect (of patches - solar relative) ? ? +/- 2% Canopy/soil Moisture (of patches) ? ? ? Thermal properties (of patches)emperature? ? ? ? of patches (Spatially relative) M=minimum, D=desired † Will be adversely affected by slopes, because you need to identify ground return energy to get cc. ‡ Assuming short-repeat (e.g., 4-8 day), non-zero baseline orbits to improve coherence to enable interferometry.
2. What are the major issues to be resolved in achieving these minimum • and desired accuracies? • - The RADAR - LIDAR columns in Q:1 “Current State of our Understanding of Tech. Capabilities” reflect the issues that need to be resolved. Those not answerable by the instrument scientists/engineers or may require case studies. • - The proposed Lidar capabilities were better understood by the panel. The physics behind its operation is more intuitive in nature and the data likely to be provided is easier to translate and cross reference to requirements. • - Contiguous (linear) profiles of lidar waveforms in critical areas would be extremely valuable to biodiversity studies - even more than non-contiguous small footprints. Profiles could be combined with textural information from other sources to extend dimensionality. • - Radar capabilities vary considerably depending upon system configuration e.g. frequency, polarization, interferometric, etc. • Should these answers/assessments be constrained by a particular type • of RaDAR? The community would appreciate guidance. For instance, LHH vs LHV markedly different. If working with an L-band, LHV is a minimum requirement. • - L-band: No coarser than 30m pixel; resolution finer than 25m is desirable. • - LiDAR: 25 m spot size for LiDAR is a maximum; 20m spot desired. • Smaller LiDAR spot size an advantage in drylands/shrublands.
3. What studies are needed to resolve these issues? - We suggest that mission trade-off studies be done on a few well understood sites that (reasonably) cover in aggregate: cross-taxa studies, varying scales and spatial contexts, and different ecosystems. These study sites should include lightly forested sites, - shrub/grassland/dryland site, - riparian site, - woodland site. - Suggestion made for 1 – 2k transect across ecozones (N-S). - We suggest a science study to assess how well shrub cover can be mapped. - Assemble LVIS and ALOS L-band “community” data sets.