The experimental setup of Test Beam
80 likes | 209 Vues
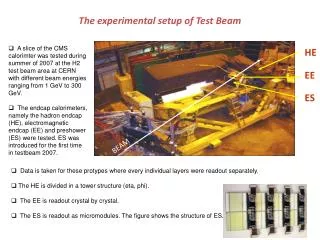
In the summer of 2007, a slice of the CMS calorimeter was tested at CERN's H2 test beam area. The experiment involved various beam energies from 1 GeV to 300 GeV, focusing on testing the hadron endcap (HE), electromagnetic endcap (EE), and introducing the preshower (ES) for the first time. Data was collected for all prototypes, employing a unique readout structure. The experiment faced challenges such as muon contamination, which required careful monitoring and data acquisition management. The response and resolution measurements of the HE were evaluated, highlighting the effects of beam energy and detector placement.

The experimental setup of Test Beam
E N D
Presentation Transcript
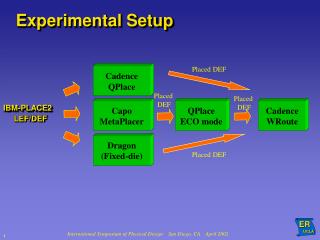
The experimental setup of Test Beam • A slice of the CMS calorimter was tested during summer of 2007 at the H2 test beam area at CERN with different beam energies ranging from 1 GeV to 300 GeV. • The endcap calorimeters, namely the hadron endcap (HE), electromagnetic endcap (EE) and preshower (ES) were tested. ES was introduced for the first time in testbeam 2007. HE EE ES BEAM • Data is taken for these protypes where every individual layers were readout separately. • The HE is divided in a tower structure (eta, phi). • The EE is readout crystal by crystal. • The ES is readout as micromodules. The figure shows the structure of ES.
The beam line of TB2007 Very low energy (VLE) line provides 1 to 9 GeV of pions and electrons with good rate, a few hundred per spill using a tertiary target. At lower end of the range, particles are mostly electrons. There is significant muon contamination as well. Particle ID is accomplished by time of flight counters (TOF), Cerenkov counters (CK) and muon veto counters (VM). High energy (HE) line covered a momentum range from 10 to 300 GeV of hadrons through secondary particle production. For electrons/ positrons, the range was 10 to 150 Gev. Cerenkov counters used CO2 and Freon as the gas medium. Wire chambers were put to align the beam precisely. The beam halo counters ensure no muon is there in hadron beam. Freon CO2
HE/EE/ES 2007 Beam Test • ES: • Two X and Y layers • each with 2 Ladders (2x4) • total 32 Si-detectors • real electronics 1024 channels • separated DAQ, DCS, DQM • EE: • Four SuperCrystals • each with 5x5 crystals • total 100 crystals • real electronics • separated DAQ, DCS, DQM
Beam cleaning – removing muon contamination Beam Halo counters Muon Veto counters Eg., For muonless events QADC <500 Eg., For muonless events QADC <350 Trigger counters Wire chambers 4 cm X 4 cm 2 cm X 2 cm mm Eg., To ensure single hit QADC <420 mm
Effect of beam cleaning on the signal in hadron endcap calorimeter Muon contamination Clean HE signal Muon contamination Clean HE signal
How energy is measured in the calorimeter Signal Pedestal distribution in ADC counts Pedestal Time slices (25ns) Calibration is done with the muons. Central tower Receives maximum “HITS” Pedestal subtracted signal multiplied with conversion factors to bring the unit in GeV
Response and resolution for Hadron endcap Response of a detector is defined as the ratio of energy deposited to the nominal beam energy. Resolution of a detector comes from statistical uncertainty, noise of the detector and fluctuations. A = due to sampling fluctuations which are Poisson in nature B=contribution due to electronics (e.g. ADC resolution) C=contribution due to calibration errors and other systematic effects Response of HE varies within 4% Resolution of HE – better with higher energy
Effect of having Ecal (EE+ES) infront of the Hadron endcap When Ecal system stays infront of the HE system then one sees the lower bump Which comes because of the early whoering that starts in the EE+ES system.