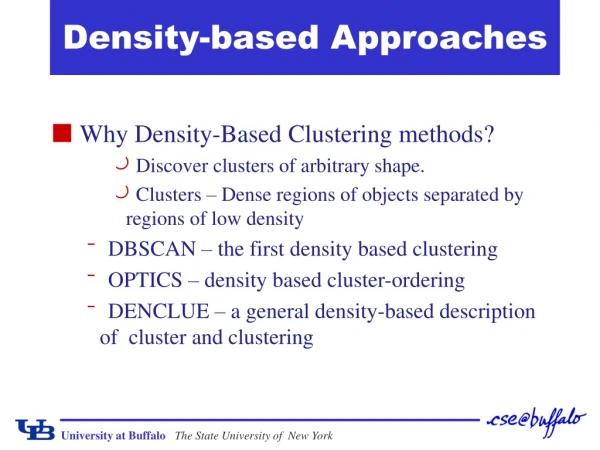
Family based approaches
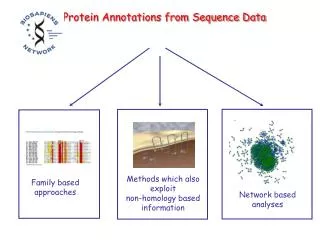
Protein Annotations from Sequence Data. Methods which also exploit non-homology based information. Family based approaches. Network based analyses. Homology based inference of protein functions. ancestral protein. a. duplication. paralogues. a. b. speciation. orthologues. a. a.

Family based approaches
E N D
Presentation Transcript
Protein Annotations from Sequence Data Methods which also exploit non-homology based information Family based approaches Network based analyses
Homology based inference of protein functions ancestral protein a duplication paralogues a b speciation orthologues a a species 1 species 2 orthologues - often have very similar functions paralogues - may have related functions
MKLNSHHIASNYEASKNFVNILQFEIRENYRSDKDSYKLDMVGSEQYASYP…. analyse residue features to predict transmembrane, localisation etc predict protein interactions search for orthologues search family resources (ortholgues and paralogues) search for conserved residues
MKLNSHHIASNYEASKNFVNILQFEIRENYRSDKDSYKLDMVGSEQYASYP…. analyse residue features predict transmembrane, localisation etc predict protein interactions search for orthologues HAMAP, EggNogg, COGS, KOGS search family resources (ortholgues and paralogues) search for conserved residues
Orthologous protein families used for High-quality Automated and Manual Annotation of microbial Proteomes in UniProtKB. 1,448 families, from Bacteria, Archaea and Plastid covering over 180,000 UniProtKB/Swiss-Prot entries, available on: http://www.expasy.org/sprot/hamap/families.html HAMAP families Anne-Lise Veuthey, SIB
Profile HAMAPpipeline UniProtKB/ TrEMBL Automatic retrieval of sequences matching the profile HAMAP family rules Automated annotation Manual checking of warnings given by the system
MKLNSHHIASNYEASKNFVNILQFEIRENYRSDKDSYKLDMVGSEQYASYP…. search for orthologues analyse residue features predict transmembrane, localisation etc predict protein interactions search family resources SMART, ProtoNet, Everest, Gene3D, CATH, InterPro Pfam, TIGR, PRINTS, SCOP search for conserved residues
Cluster 4.5 million sequences (510 completed genomes) into protein superfamilies using APC clustering algorithm • (2) Map domains onto the sequences using HMM technology (CATH & Pfam domains) 335,000 protein superfamilies (orthofams) (189,000 have >5 sequences) 19% are singletons BLAST, APC ~11,000 domain superfamilies (2100 CATH of known structure – account for ~85% of domains) CATH, Pfam HMM libraries
Gene3D - OrthoFams Functional annotation of selected node Root Node 30% ID 95% ID • 335,000 Protein families built using Affinity Propogation Clustering. • Annotated with FunCat, HAMAP, EC, KEGG, GO, IntACT, HPRD, and others. • Benchmarking – 99.9% map to single HAMAP
Functional Catalogue (FunCat) Dmitrj Frishmann, GSF • Organized hierarchically with up to six levels. • ~1307 categories • Currently 9 organisms incorporated: yeast, human, A.thaliana, …
ProtoNet and EVEREST family resources Michal Linial, HUJI Michal Linial, HUJI ProtoNet 5.1 2.5M sequences EVEREST 2.0
B22 B40 B14 B32 B44 B 10 B31 B13 B26 B27 B16 B11 B28 B37 B7 B3 B25 B29 B19 B18 B9 B20 B42 B23 B30 B5 B12 B34 B38 B39 B1 B43 B17 B35 B21 B4 B36 B33 B15 B8 .Root B24 B6 B41 B2 E1 E2 AE A8 A10 A3 A6 A9 A7 A1 A11 A5 A4 A12 A2 2.5M sequences from UniProt UPGMA efficient clustering algorithm Benchmarked against Pfam, SCOP
For each cluster annotation assigned an Annotation Score if proteins achieve p-value <= 0.001 (b) Only clusters with > 5 proteins are considered (c) Purity is >0.9 (TP/ TP+FN) (d) Combination of functional keywords For each protein, assign the annotations of its cluster and all parents >40% of the clusters and 65% of proteins assigned a safe ProtoName ProtoName: safe inference of annotation
~11%of PROTEIN superfamilies in a genome are common to all kingdoms, protein superfamily
~11%of PROTEIN superfamilies in a genome are common to all kingdoms, common domains protein superfamily nearly 60% of domains are from ~200 superfamilies COMMON to all major kingdoms these have been combined in different ways to modulate function
B22 B40 B14 B32 B44 B 10 B31 B13 B26 B27 B16 B11 B28 B37 B7 B3 B25 B29 B19 B18 B9 B20 B42 B23 B30 B5 B12 B34 B38 B39 B1 B43 B17 B35 B21 B4 B36 B33 B15 B8 .Root B24 B6 B41 B2 E1 E2 AE A8 A10 A3 A6 A9 A7 A1 A11 A5 A4 A12 A2 Evolution of functional subfamilies within superfamilies + + superfamily +++ +++ +++ ++ Species tree built on the small subunit (SSU) ribosomal RNA COG functional categories
parent functions protein biosynthesis signal transduction poorly characterised metabolism child functions Percentage frequencies of functional shifts within domain superfamilies Function is predominantly conserved within the same COG functional subcategory or major category However, there are clearly cases of major functional shifts
<10% of domain superfamilies (<200) are highly expanded in the genomes and functionally very diverse Structural Diversity ~2000 superfamilies Population in genomes (x 1000)
N-fold increase in functional annotation using pairwise sequence identity thresholds N-fold increase in coverage family specific thresholds general thresholds >50% sequence identity - 90% probability of having related functions If the domains have the same multidomain context >30% sequence identity – 90% probability of having related functions
Some superfamilies contain multiple diverse functional subfamilies
MKLNSHHIASNYEASKNFVNILQFEIRENYRSDKDSYKLDMVGSEQYASYP…. analyse residue features predict transmembrane, localisation etc predict protein interactions search for orthologues search family resources (orthologues and paralogues) search for conserved residues TreeDet, ScoreCons, GEMMA ETtrace, SCI-PHY, FunShift
Identify functional subfamilies by using information on sequence conserved residue positions multiple sequence alignment of relatives from functional subfamily 1 = highly conserved Structural model Score conservation for each position in the alignment using an entropy measure 0 = unconserved Putative functional site Scorecons –Thornton TreeDet - Valencia
Phylogenetic trees derived from multiple sequence alignments can be used to identify functional subfamilies TreeDet - Valencia SCI-PHY – Sjolander FunShift – Sonnhammer ETtrace - Lichtarge
TreeDet method for identifying functional subfamilies AlfonsoValencia group, CNIO
GEMMA: Compares sequence profiles (HMMs) between subfamilies using COMPASS method sequence subfamily 90% seq. id domain superfamily putative functional subfamily clusters sequence relatives predicted to have related functions
GeMMA v SCI-PHY using gold standard Babbitt benchmark of 5 large curated superfamilies Purity (high is best) Edit distance (low) VI distance (low is best) Deviation from no. singletons (low)
Coverage of superfamily (%) experimental annotations inherit functions at 50% seq. id. inherit functions by GEMMA Functional annotation coverage using different strategies
MKLNSHHIASNYEASKNFVNILQFEIRENYRSDKDSYKLDMVGSEQYASYP…. analyse residue features predict transmembrane MEMSAT, TMHMM, ENSEMBLE, PONGO predict protein interactions search for orthologues analyse residue features predict disorder, signal peptides, localisation Barcello, DisoPred, FFpred search family resources (orthologues and paralogues) search for conserved residues
A ’biological’ hydrophobicity scale(Hessa et al., Nature 433:377 & 450:1026; Bernsel et al. PNAS in press) Gunnar Von Heijne, STO
Pongo annotation engine Rita Casadio, UNIBO Seven predictors at the core: • all-α TM topology; • TMHMM 2.0 • MEMSAT • PRODIV • ENSEMBLE • ENSEMBLE 2.0 • TMHMM DOMFIX • signal peptide; • SPEP http://pongo.biocomp.unibo.it/pongo
Performance of the high scoring methods on the 121 high-resolved chains (from PDB) Correct Topography: Correct Position of TMhelices along the sequence Correct Topology: Correct Position AND Correct Orientation with respect to the membrane plane
The PONGO engine: http://pongo.biocomp.unibo.it Amico M, Finelli M, Rossi I, Zauli A, Elofsson A, Viklund H, von Heijne G, Jones D, Krogh A, Fariselli P, Martelli PL, Casadio R -PONGO: a web server for multiple predictions of all-alpha transmembrane proteins- Nucleic Acids Res 34(Web server issue):169-172 (2006)
CBS prediction servers Soren Brunak, DTU Broad range of prediction servers Amino acid sequence based methods within: Protein sorting Post-translational modifications of proteins Protein function and structure Immunological features Local protein features, e.g. “kinase-specific phosphorylation site”, “nuclear export signal”, “propeptide cleavage site” Global properties, e.g. “cell cycle regulated”, “secreted via a non-classical pathway”, “member of the nucleolar subproteome”, GO categories, EC categories, ...
FFPred: An Integrated Feature based Function Prediction Server for Vertebrate Proteomes David Jones, UCL > 300 GO Term Classifiers for both Molecular Process and Biological Function Categories Inferring function using patterns of native disorder in proteins. Lobley, A.E., Swindells, M.B., Orengo, C.A. & Jones, D.T. (2007) PLoS Comput. Biol. 3:e162.
Protein Annotations from Sequence Data Network based analyses
CORUM: the comprehensive resource of mammalian protein complexes Dmitrj Frishmann, GSF • consists of 2100 protein complexes • covers ~3000 different proteins, representing 15% of protein coding genes in mammals No of Proteins/ Protein complexes
MKLNSHHIASNYEASKNFVNILQFEIRENYRSDKDSYKLDMVGSEQYASYP…. analyse residue features predict transmembrane, disorder etc search interactions resources CORUM, IntAct, HPRD, BIND search for orthologues Predict interactions STRING, DIMA G3D-BioMiner PROLINKS search family resources (orthologues and paralogues) search for conserved residues
hiPPI homology inherited Protein-Protein Interactions Gene3D-BioMiner CODA Co-Occurance of Domains Analysis PhyloTuner Domain family co-evolution detection Weighted Integration GECO Gene Expression Correlation Visualisation in CytoScape Adding known functional associations i.e. from FunCat.
CODA: FUSED DOMAINS BioMiner Specie 1 Specie 2 Method adapted from Enright, Ouzounis but a new scoring scheme has been developed
HiPPI: Protein-protein physical interaction data Homology Inferred Protein Protein Interactions Inherit data provided by HPRD, IntAct, BIND, CORUM Superfamily A Superfamily B
CATH Domain Superfamily Organism 1 2 3 4 12 13 14 11 Superfamily 1 35 0 12 60 Superfamily 2 6 0 0 0 Superfamily 3 Eisenberg Phylogenetic Profiles for Detecting Functional Associations Superfamily Organism 1 2 3 4 Functionally Linked 1 0 1 0 presence or absence of superfamily in organism Superfamily 1 1 0 1 0 Superfamily 2 0 0 1 1 Superfamily 3 Gene3D Phylogenetic Occurrence Profiles number of sequence relatives from superfamily in organism
CATH Domain Superfamily Organism 1 2 3 4 3 6 4 5 Superfamily 1 7 0 3 0 Superfamily 2 6 0 2 0 Superfamily 3 Eisenberg Phylogenetic Profiles for Detecting Functional Associations Superfamily Organism 1 2 3 4 Functionally Linked 1 0 1 0 presence or absence of superfamily in organism Superfamily 1 1 0 1 0 Superfamily 2 0 0 1 1 Superfamily 3 Gene3D PhyloTuner Occurrence Profiles Ranea et al. (2007) PLOS Comp. Biol. number of sequence relatives from superfamily in organism
Phylo-Tuner algorithm Phylogenetic Occurrence Profile Matrix Domain Superfamilies clustered at different levels of sequence identity: Sup. S30 S35 S40 S50 … (S100) Species2 Species3 Species1 Superfamily
Superfamily X Ematch 10 5 Sp1 Sp2 Sp3 Sp4 Sp5 … Spn Sp1 Sp2 Sp3 Sp4 Sp5 … Spn Sp1 Sp2 Sp3 Sp4 Sp5 … Spn Euclidian distance: 3 0 6 0 4 … 10 4 3 7 5 6 … 5 0 0 1 0 2 … 1 1 2 1 0 1 … 6 1 4 0 4 1 … 4 0 4 5 2 0 … 1 2 6 4 8 4 … 7 . . . . . … . . . . . . … . . . . . . … . 0 1 0 1 1 … 0 6 0 6 9 5 … 9 4 3 7 5 3 … 5 1 0 1 0 2 … 1 0 2 0 0 1 … 6 1 4 1 4 1 … 4 0 3 5 2 0 … 1 4 8 4 8 4 … 8 . . . . . … . . . . . . … . . . . . . … . 0 1 0 1 1 … 0 Cluster 1 Cluster 2 Cluster 3 Cluster 4 Cluster 5 Cluster 6 Cluster 7 . . . Cluster n Cluster 1 Cluster 2 Cluster 3 Cluster 4 Cluster 5 Cluster 6 Cluster 7 . . . Cluster n Ematch <<<< Eall_rest Zs = Superfamily Y Xi Ematch Zs calculations Sup. Sup. S30 S30 S35 S35 S40 S40 S50 … (S100) S50 … (S100) Phylo-Tuner
Highly similar profiles correspond to pairs of families with significant similarity in GO functions Biological process true positives false positives ratio of true positives to false positives Ranea et al. (2007) PLOS Comp. Biol.
Performance of Gene3D-BioMiner integrated methods assessed using a yeast genome dataset and semantic similarity of GO terms
Finn et al. 2005 Stein et al. 2005 Phylogenetic domain profiling 460 completed genomes! PF1 100101110001110001 PF2 011100011101001100 PF3 100101110001110001 PF4 110001000100100000 SIMAP/BOINC for Pfam domain search PPI → DDI (DPEA: Riley et al.) 2 versions: known PPIs predicted PPIs Domain interactions derived from PDB
STRING – functional protein interactions Peer Bork, EMBL • 378 genomes • Interaction evidence • Genomic context • Primary experiments • Pathway databases • Literature mining • New network viewer • Confidence view vs. evidence view • Miniature protein structures
Denoising Protein Interaction Networks Christos Ouzounis, CERTH Protein interaction networks • Over 2 million interactions in 184 genomes, previously uncharacterised • Filtering out promiscuous domains, excluding implausible interactions • Kamburov A et al. 2007) Denoising inferred functional association networks obtained by gene fusion analysis. BMC Genomics, 2007; 8(1):460
Evaluation of graph-based clustering algorithms for extracting complexes from protein interaction networks Sylvain Brohée and Jacques van Helden (2006). BMC Bioinformatics 7: 488 • Evaluation protocol • Reference complexes: MIPS database • Test with altered networks: various proportions of random edge addition/removal. • Testing of all parametric conditions. • Definition of assessment statistics (Sensitivity, Positive Predictive Value, Accuracy) Reference network: MIPS complexes Altered network (100% edge additions, 40% removal)