Final Project
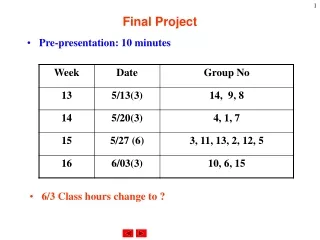
Final Project. SNMP. Introduction. Use SNMP to collect system information and graph with RRDTool Prerequisites SNMP software net-mgmt/net-snmp Graphing databases/rrdtool. Net-SNMP. An extendable SNMP implementation Command snmpget snmpset snmpwalk …etc Turotials

Final Project
E N D
Presentation Transcript
Final Project SNMP
Introduction • Use SNMP to collect system information and graphwith RRDTool • Prerequisites • SNMP software • net-mgmt/net-snmp • Graphing • databases/rrdtool
Net-SNMP • An extendable SNMP implementation • Command • snmpget • snmpset • snmpwalk • …etc • Turotials • http://www.net-snmp.org/wiki/index.php/Tutorials
RRDTool • Round-robin database • Data logging / graphing • Known for its pretty graphing • Easy integration • Bindings for Python, Perl, Ruby, Lua … • Command line tools also enable integration with shell scripts • Documentation • http://oss.oetiker.ch/rrdtool/doc/index.en.html
RRDTool – Compared with MRTG • MRTG • RRDTool
RRDTool – Flow • Create • Create a new RRD • $ rrdtool create • Fetch data • Via SNMP, external programs… etc • Update • Update the data • $ rrdtool update • Graph • Graph the result • $ rrdtool graph create RRD file fetch data update graphing
RRDTool – Create /usr/local/bin/rrdtool create \ /usr/local/share/cacti/rra/ggyy.rrd \ --step 300 \ DS:5min_cpu:GAUGE:600:0:100 \ RRA:AVERAGE:0.5:1:600 \ RRA:AVERAGE:0.5:6:700 \ RRA:AVERAGE:0.5:24:775 \ RRA:AVERAGE:0.5:288:797 \ RRA:MAX:0.5:1:600 \ RRA:MAX:0.5:6:700 \ RRA:MAX:0.5:24:775 \ RRA:MAX:0.5:288:797 \
RRDTool – Create (Cont.) • Data source (DS) • DS:ds-name:DS Type:DST arguments • e.g. DS:5min_cpu:GAUGE:600:0:100 • Round-robin archive (RRA) • RRA:Consolidation Function:CF arguments • e.g. RRA:AVERAGE:0.5:288:797
RRDTool – Update • Use SNMP or other external program to get the value • Inflow=`snmpget -c public 127.0.0.1 ifInOctets.1` • data=`hexdump -n4 -e\"%u\" /dev/random` • Updating would be combined with graphing • This poller should be invoked every ${step} sec. #### update.sh #### # update Data=`get some value` # graph rrdtool graph ${PIC} …
RRDTool – Graph /usr/local/bin/rrdtool graph \ Aabbabc.png \ --title=‘Router' \ DEF:a="/usr/local/share/cacti/rra/ggyy.rrd":5min_cpu:AVERAGE \ AREA:a#FF0000FF:"CPU Usage" \ GPRINT:a:LAST:"Current\:%8.0lf" \ GPRINT:a:AVERAGE:"Average\:%8.0lf" \ GPRINT:a:MAX:"Maximum\:%8.0lf\n"
Requirement • Access control • Use difference community name for RO / RW • Use RRDTool to monitor & graph host’s status • CPU usage • Memory usage • Uptime • Interface netflow (input/output) • Enable snmptrapd to receive traps • Specify and implement a handler for a specific OID
Bonus – Cacti with Plugin Architecture • Install Cacti with PA support • Import and organize existing RRDs • http://goo.gl/5ga6G
Hand-in • Due • 6/23 • Demo • TBA
Appendix SNMP related use case in CSCC
Switch Management – Interface Shutdown • 情境: 電資有小白在衝 ip • Solution 1 • 拔他線 • 電資超遠, 下雨天不想出門… • Solution 2 • 從上層 ban 掉他 mac • 同一台 L2 switch 下的使用者表示遺憾… • Solution 3 • 從 switch 上 ban 掉 ! • $ snmpset -v1 -c letmein 140.113.235.1 interfaces.ifTable.ifEntry.ifAdminStatus.123 i 2
Switch Management – 斷網 • Similar to shutting down an interface • Move some ports to restricted VLANs • Only do NAT for non-restricted VLANs • 802.1Q support in FreeBSD Trunk VLAN 56 (allowed) NAT pass 324 315 316 VLAN 78 (restricted) block 330
Monitoring – Cacti • 50+ switches…