Download
1 / 27
270 likes | 429 Vues
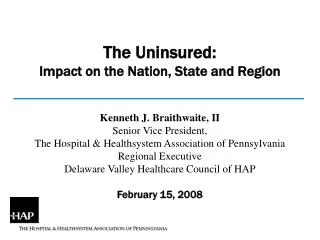
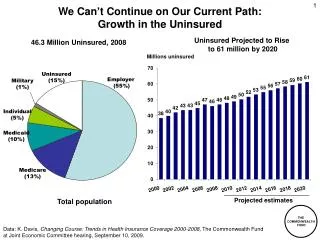
We Can’t Continue on Our Current Path: Growth in the Uninsured. Uninsured Projected to Rise to 61 million by 2020. 46.3 Million Uninsured, 2008. Millions uninsured. Uninsured (15%). Employer (55%). Military (1%). Individual (5%). Medicaid (10%). Medicare (13%).

E N D
We Can’t Continue on Our Current Path: Growth in the Uninsured Uninsured Projected to Rise to 61 million by 2020 46.3 Million Uninsured, 2008 Millions uninsured Uninsured (15%) Employer (55%) Military (1%) Individual (5%) Medicaid (10%) Medicare (13%) Projected estimates Total population Data: K. Davis, Changing Course: Trends in Health Insurance Coverage 2000-2008, The Commonwealth Fund at Joint Economic Committee hearing, September 10, 2009.
We Can’t Continue on our Current Path: Growth in National Health Expenditures per Capita Data: OECD Health Data 2009 (June 2009)
We Can’t Continue on our Current Path:Average Family Premium as a Percentage of Median Family Income, 1999–2020 Projected Source: K. Davis, Why Health Reform Must Counter the Rising Costs of Health Insurance Premiums, The Commonwealth Fund, August 2009.
Employers and Families Can’t Afford Rising PremiumsEmployer/Employee Premiums for Family Coverage, 2008 and 2020 Health insurance premiums for family coverage 1 1The lowest state is Idaho; highest state is Massachusetts. Data: 2008 premium data from Agency for Healthcare Research and Quality, Center for Financing, Access and Cost Trends, 2008 Medical Expenditure Panel Survey-Insurance Component; Premium estimates for 2020 based on CMS, Office of the Actuary, National Health Statistics Group, national health expenditures per capita annual growth rate. Source: C. Schoen, J.L. Nicholson, S.D. Rustgi, Paying the Price: How Health Insurance Premiums Are Eating Up Middle-Class Incomes, State-by-State Health Insurance Premium Projections With and Without National Reform (New York: The Commonwealth Fund) August 2009.
We Can’t Afford to Continue to Lag on Health OutcomesMortality Amenable to Health Care Deaths per 100,000 population* * Countries’ age-standardized death rates before age 75; including ischemic heart disease, diabetes, stroke, and bacterial infections. Data: E. Nolte and C.M. McKee, "Measuring the Health of Nations: Updating an Earlier Analysis," Health Affairs Jan.-Feb. 2008, 27(1):58-71 analysis of World Health Organization mortality files. Source: Commonwealth Fund National Scorecard on U.S. Health System Performance, 2008.
Five Key Strategies for High Performance • Extending affordable health insurance to all • Organizing care around the patient • Aligning financial incentives to enhance value and achieve savings • Meeting and raising benchmarks for high-quality, efficient care • Ensuring accountable national leadership and public/private collaboration Source: Commission on a High Performance Health System, A High Performance Health System for the United States: An Ambitious Agenda for the Next President, The Commonwealth Fund, November 2007
Features of National Health Reform Proposals, 2008 Source: Commonwealth Fund analysis of health reform proposals.
Coverage Expansion Provisions of H.R. 3200As Amended by Energy and Commerce • Insurance market reform: • Guaranteed issue without regard to health status • Modified community rating (2:1 by age) • Insurance exchange • Premium and cost-sharing assistance up to 400% of poverty • Medicaid expansion up to 133% of poverty Individual mandate • Employer shared responsibility • Provide 72.5%+ premium contribution for individuals or 65% for families or face penalty of 2%-8% payroll (phased in by firm size) • Small businesses (<$500,000 payroll) excluded • Health coverage tax credits for small businesses with <25 employees and average wages <$40,000 • Up to 50% premium costs for employers with up to 10 employees and average wages <$20,000 • Sliding scale by firm size and average wage increases; not available for employees earning $80,000+
Premiums Under Current Law and H.R. 3200As Amended by Energy and Commerce Data: House of Representatives Ways and Means Committee
Cost Sharing Credits Reduce Limits on Cost-Sharing Source: House of Representatives Ways and Means Committee
Trend in the Number of Uninsured, 2012–2020Under Current Law and H.R. 3200 Millions Note: The uninsured includes unauthorized immigrants. With unauthorized immigrants excluded from the calculation, nearly 97% of legal nonelderly residents are projected to have insurance under the proposal. Data: Estimates by The Congressional Budget Office.
System Reform Provisions of H.R. 3200As Amended by Energy and Commerce • Payment reform • Enhanced payment for primary care: 5% overall, 10% in shortage areas • Replaced formula for updating physician fees: separate updates for primary care (GDP+2%) and specialty services (GDP+1%) • Geographic variations: IOM study; 5% add-on in lowest utilization areas • Rapid cycle testing of innovative payment methods • Medical homes • Accountable care organizations • Bundled payments for hospital and post-acute care • Choice of public and private plans • Cost containment • Productivity improvement; reduction for high hospital readmissions • Negotiation of pharmaceutical prices; prescription drug savings • Resetting Medicare Advantage rates to FFS levels with quality bonuses • Health insurance exchange administrative savings for individuals and small businesses • Limit on premium increases to 150% medical inflation • Quality improvement, measurement, public reporting • Health goals and priorities for performance improvement • Center for comparative effectiveness
Potential Impact of Payment Reforms on National Health Expenditures Compared with Current Projection, 2010–2020 (in billions) Source: The Commonwealth Fund, The Path to a High Performance U.S. Health System, 2009.
Projected 10-Year Medicare Spending Under H.R. 3200 “America’s Affordable Health Choices Act of 2009” Dollars in billions CER 1% ($2) Other Provisions 7% ($25) Preventive Services 1% ($4.3) Primary Care Services 2% ($6.4) Interactions 7% ($22.4) Geographic Adjustment 2% ($8) Formula Update Revision For Physician Payments 72% ($228.5) MA Payment Reforms 3% ($9.6) MSP & LIS 4% ($13.9) 10-Year Spending (2010-2019) $320.4 Billion Source: Kaiser Family Foundation analysis of Congressional Budget Office (CBO) cost estimates as provided on July 17, 2009, and Joint Committee on Taxation (JCT) estimates as provided on July 17, 2009 for H.R. 3200.
Projected 10-Year Medicare Savings Under H.R. 3200“America’s Affordable Health Choices Act of 2009” Other Provisions 6% ($33.6) Savings in billions of dollars Interactions 7% ($37.7) DSH Payments 2% ($10.2) Reducing Hospital Readmissions 4% ($19.1) Part D Gap & Dual Eligibles 6% ($29.7) Annual Payment Updates for Providers 37% ($200.5) Other Home Health 6% ($34.2) MA Payment Reforms 32% ($172) 10-Year Savings (2010-2019) $538.5 Billion Source: Kaiser Family Foundation analysis of Congressional Budget Office (CBO) cost estimates as provided on July 17, 2009, and Joint Committee on Taxation (JCT) estimates as provided on July 17, 2009 for H.R. 3200.
8.0% annual growth 7.3% annual growth Total Federal Health Expenditures, 2010–2019:Current Projection and Alternative Scenarios Billions $1,712 $1,674 7.8% annual growth $1,624 $860 Data: Estimates by The Commonwealth Fund using Congressional Budget Office (CBO) cost estimates as provided on July 17, 2009, and Joint Committee on Taxation (JCT) estimates as provided on July 17, 2009 for H.R. 3200.
Cost of Administering Health Insurance as a Percentage of Claims Under Current Law and the Proposed Exchange, by Group Size Percent . Source: Commonwealth Fund Commission on a High Performance Health System, The Path to a High Performance U.S. Health System: A 2020 Vision and the Policies to Pave the Way, (New York: The Commonwealth Fund, Feb. 2009).
9.1% annual growth 6.3% annual growth Potential Effect of Limits on Premium IncreasesLimit of 150% Medical Inflation Annual family premiums $12,680 $10,078 $5,791 Source: Commonwealth Fund calculations based on U.S. Bureau of Labor Statistics, Kaiser HRET.
NH ME WA VT ND MT MN OR MA NY WI SD ID RI MI WY CT PA NJ IA OH NE DE NV IN IL MD WV UT VA DC CO CA MO KS KY NC TN OK SC AR AZ NM GA MS AL LA TX FL 80%–100% 70%–79% 50%–69% Less than 50% Concentrated Insurance Markets: Market Share of Two Largest Health Plans, by State, 2006 AK HI Note: Market shares include combined HMO+PPO products. For MS and PA share = top 3 insurers 2002-2003. Source: American Medical Association, Competition in health insurance: A comprehensive study of U.S. markets, 2008 update; MS and PA from J. Robinson, “Consolidation and the Transformation of Competition in Health Insurance,” Health Affairs, Nov/Dec 2004; ND from D. McCarthy et al., “The North Dakota Experience: Achieving High-Performance Health Care Through Rural Innovation and Cooperation,” The Commonwealth Fund, May 2008.
Estimated Annual PremiumsUnder Different Scenarios, 2010 Average annual premium per household for same benefits at community rate* 3% 14% 16% 25% * Premiums for same benefits and population. Benefits used to model: full scope of acute care medical benefits; $250 individual/$500 family deductible; 10% coinsurance physicians services; 25% coinsurance, no deductible prescription drugs ; full coverage preventive care. $5,000 individual/$7,000 family out-of-pocket cost limit. Source: C. Schoen, K. Davis, S. Guterman, and K. Stremikis, Fork In the Road: Alternative Paths to a High Performance U.S. Health System, The Commonwealth Fund, June 2009.
6.5% annual growth 5.2% annual growth 5.6% annual growth Total National Health Expenditures, 2009–2020: Current Projection, Path, and Illustrative Ways and Means, Energy and Commerce Scenarios NHE in trillions $5.0 ?? $4.6 $4.4 $2.5 Note: GDP = Gross Domestic Product. Data: Estimates by The Commonwealth Fund.
Average Annual Savings per Family Under Health Reform That Controls Premium Growth, 2020 Savings in health care spending compared with projected trends Family Income ($ thousands) Data: Estimates by The Lewin Group for The Commonwealth Fund. Source: The Commonwealth Fund Commission on a High Performance Health System, The Path to a High Performance U.S. Health System: A 2020 Vision and the Policies to Pave the Way (New York: The Commonwealth Fund, February 2009).
Major Sources of Savings And Revenues Compared with Projected Spending, Net Cumulative Effect on Federal Deficit, 2010–2019 Dollars in billions Source: The Congressional Budget Office Analysis of HR 3200, The Affordable Health Choices Act, July 17, 2009, http://www.cbo.gov/ftpdocs/104xx/doc10464/hr3200.pdf
CBO Estimates of Major Health Legislation Compared to Actual Impact on Federal Outlays Source: J. Gabel, “Congress’s Health Care Numbers Don’t Add Up,” New York Times, August 25, 2009.
Bending the Curve: Options that Achieve SavingsCumulative 10-Year Federal Budget Savings Aligning Incentives with Quality and Efficiency Path estimate CBO estimate OMB estimate • Hospital Pay-for-Performance -$ 43 billion -$ 3 billion -$ 12 billion • Bundled Payment with Productivity Updates -$123 billion -$201 billion -$110 billion • Strengthening Primary Care and Care Coordination -$ 83 billion +$ 6 billion --- • Modify the Home Health Update Factor --- -$ 50 billion -$ 37 billion Correcting Price Signals in the Health Care Market • Reset Medicare Advantage Benchmark Rates -$135 billion -$158 billion -$175 billion • Reduce Prescription Drug Prices -$ 93 billion -$110 billion -$ 75 billion • Limit Payment Updates in High-Cost Areas -$100 billion -$ 51 billion --- • Manage Physician Imaging -$ 23 billion -$ 3 billion --- Producing and Using Better Information • Promoting Health Information Technology -$ 70 billion -$ 61 billion -$ 13 billion • Comparative Effectiveness -$174 billion +$ 1 billion --- Promoting Health and Disease Prevention • Public Health: Reducing Tobacco Use -$ 79 billion -$ 95 billion --- • Public Health: Reducing Obesity -$121 billion -$ 51 billion --- • Public Health: Alcohol Excise Tax -$ 47 billion -$ 60 billion --- Source: R. Nuzum et al., Finding Resources for Health Reform and Bending the Health Care Cost Curve, (New York: The Commonwealth Fund, June 2009).
Illustrative Health Reform Goals and Tracking Performance • Secure and Stable Coverage for All • Percent of population insured • Percent of population with premiums and out-of-pocket expenses within affordability standard • Slowing Growth of Total Health Spending and Federal Health Outlays • Annual growth rate in total health system expenditures • Annual growth rate in Medicare expenditures • Impact on federal budget: new spending, net savings, new revenues • Health Outcomes and Quality • Percent of population receiving key preventive services or screenings • Percent of population with chronic conditions controlled • Percent reduction in gap between benchmark and actual levels of quality and safety • Payment and Delivery System Reform • Percent of population enrolled in medical homes • Percent of physicians practicing in accountable care organizations • Percent of provider revenues based on value
Historic Opportunity for Change • The U.S. has a historic opportunity to adopt reforms that will achieve a high performance health system; we can’t afford to continue on our current course • Goals of stable and secure coverage for all are achievable; requires one-time shift in federal budget to assist uninsured and underinsured • Slowing growth in total health spending and Medicare outlays is achievable • Investing in primary care • Rapid cycle testing of innovative payment reforms to reward quality and value • Productivity improvement • Correcting market price signals: Medicare Advantage, Rx • Choice and competition: public/co-op plan; limits on plan premium growth • Harmonization of private and public payment methods • Independent commission • Budget-neutrality is achievable through combination of cost-containment and new revenues • Oversight and system of tracking performance will be needed