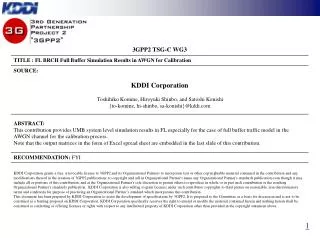
Comprehensive Simulation of Full Buffer and AWGN Curves for 8 Tiles in Wireless Communication
This document presents a detailed simulation setup focusing on full buffer scenarios and Additive White Gaussian Noise (AWGN) characteristics across eight tiles. It incorporates PF selection mechanisms and offers insights through various metrics, including throughput, Carrier-to-Interference ratio (C/I), and Packet Error Rate (PER) under specified conditions. The results showcase average sector throughput and statistics on user performance, along with detailed HARQ and transmission rate evaluations. Supporting files for calibration and layout are included for comprehensive analysis and replication.

Comprehensive Simulation of Full Buffer and AWGN Curves for 8 Tiles in Wireless Communication
E N D
Presentation Transcript
Simulation Setup • FL Full buffer simulation • AWGN curves of 8tiles • PF selection • C30-20071203-020-QCOM-SINR_to_CQI_mapping_in_calibration.pdf • Layout file • C30-20071203-019-QCOM-Location_files_for_calibration.zip • Counting interval for results • Throughput: 10kbps • C/I: 0.25dB • PER: 0.01
AWGN channel • Aggregate sector throughput Average: 11272.97kbps
AWGN channel • User throughput Cell edge user (95%) throughput: 2189.882kbps
AWGN channel • PER distribution
AWGN channel • Normalized per user average throughput
AWGN channel • Transmission rate vs. C/I
AWGN channel • HARQ statistics (distribution)
AWGN channel • Packet format selection distribution
Excel file • AWGN channel