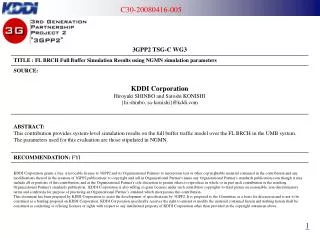
Comprehensive FL Full Buffer Simulation with TU3 Channel Model and ITU Model
This simulation setup covers all parameters and methods as per the guidelines in the provided spread sheets. It includes the use of Effective SNR curves, PER curves, backoff application, capacity curves, ITU Model (TU3), and CQI Mapping for PF Selection. The simulation considers FLCS power, scheduler implementation, and aggregate sector throughput for detailed analysis.

Comprehensive FL Full Buffer Simulation with TU3 Channel Model and ITU Model
E N D
Presentation Transcript
Simulation Setup • FL Full buffer simulation • All the parameters and methods for the simulations follow both the parameter spread sheet in C30-20080416-001 and the output metrics spread sheet in C30-20080114-021R2 • Note: • Effective SNR AWGN curves (C30-20080114-029) is used. • The PER curves for 8 tiles are used. • The backoff (C30-20080114-033R1, PedB3 case) is applied. • Capacity curves (C30-20071105-013) is used. • ITU Model (TU3) as the channel model • BRCH for F-DCH • CQI Mapping (for PF Selection): C30-20071203-020R2 • AT Layout: C30-20080416-002 • FLCS power is considered. • Scheduler: in line with the pseudo code in C30-20080331-031R1 • The value for CDF is the left (=min) value of bin.
TU3 channel • Aggregate sector throughput Average throughput: 12.44Mbps Edge user throughput: 455.3kbps
TU3 channel • PER distribution
TU3 channel • Normalized per user average throughput
TU3 channel • Average PHY throughput per AT vs. Geometry
TU3 channel • HARQ statistics (distribution)
TU3 channel • Packet format selection distribution
TU3 channel • CDF of AT Throughput
Appendix ~ Output Metrics Spread Sheets ~ • TU3 channel