Analyzing Ray Rice's Rush Yards Distribution: A Statistical Approach
This quiz involves modeling the rushing yards of football player Ray Rice using a normal distribution with a mean of 4.6 yards and a standard deviation of 1.4 yards. Participants will calculate the percentage of rushes greater than 6 yards and the percentage between 4.4 and 8 yards. Students will utilize Z-scores and statistical tools, such as Minitab, to visualize the data and determine the necessary percentages. This exercise enhances understanding of normal distributions and their applications in sports statistics.

Analyzing Ray Rice's Rush Yards Distribution: A Statistical Approach
E N D
Presentation Transcript
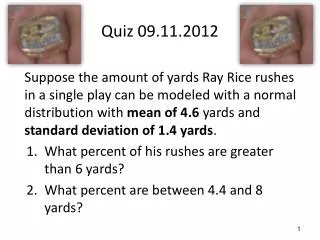
Quiz 09.11.2012 Suppose the amount of yards Ray Rice rushes in a single play can be modeled with a normal distribution with mean of 4.6 yards and standard deviation of 1.4 yards. • What percent of his rushes are greater than 6 yards? • What percent are between 4.4 and 8 yards?
# 1 • First draw a picture (should look something like the minitab below, but not in z score scale). • The next thing we do is find the z score. • We know . • Now, either using minitab or a table (like appendix d in the back of the book) we find the percentage. • We get 0.1587 or 15.87%. • Minitab plot to the right.
# 2 • First draw a picture (should look something like the minitab plot below, but not in z scores scale) • The next thing we do is find the z scores. • We know. • Now, either using minitab or a table, we find the percentage. • We get 0.5492 or 54.92%. • Minitab plot to the right.