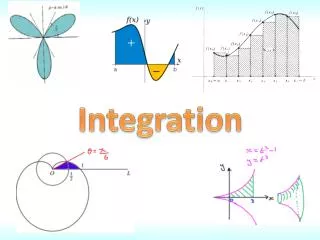
Integration
4. Integration. Area. 4.2. Sigma Notation. Sigma Notation. This notation is called sigma notation (Notation for sums) because it uses the uppercase Greek letter sigma, written as. Example 1 – Examples of Sigma Notation.


Integration
E N D
Presentation Transcript
4 Integration
Area 4.2
Sigma Notation This notation is called sigma notation (Notation for sums) because it uses the uppercase Greek letter sigma, written as
Example 1 – Examples of Sigma Notation From parts (a) and (b), notice that the same sum can be represented in different ways using sigma notation.
Example 1 – Examples of Sigma Notation From parts (a) and (b), notice that the same sum can be represented in different ways using sigma notation.
Example 1 – Examples of Sigma Notation From parts (a) and (b), notice that the same sum can be represented in different ways using sigma notation.
Example 1 – Examples of Sigma Notation From parts (a) and (b), notice that the same sum can be represented in different ways using sigma notation.
Example 1 – Examples of Sigma Notation From parts (a) and (b), notice that the same sum can be represented in different ways using sigma notation.
Example 1 – Examples of Sigma Notation From parts (a) and (b), notice that the same sum can be represented in different ways using sigma notation.
Example 1 – Examples of Sigma Notation From parts (a) and (b), notice that the same sum can be represented in different ways using sigma notation.
Example 1 – Examples of Sigma Notation From parts (a) and (b), notice that the same sum can be represented in different ways using sigma notation.
Example 1 – Examples of Sigma Notation From parts (a) and (b), notice that the same sum can be represented in different ways using sigma notation.
Example 1 – Examples of Sigma Notation From parts (a) and (b), notice that the same sum can be represented in different ways using sigma notation.
Example 2 – Evaluating a Sum Solution: Applying Theorem 4.2, you can write
Example 2 – Solution cont’d Now you can evaluate the sum by substituting the appropriate values of n, as shown in the table.
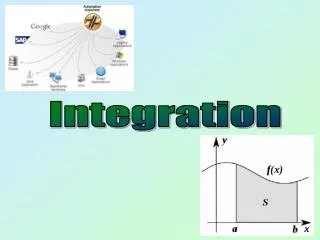
Area In Euclidean geometry, the simplest type of plane region is a rectangle. We know the definition of the area of a rectangle is A = bh. From this definition, you can develop formulas for the areas of many other plane regions.
Area For example, to determine the area of a triangle, you can form a rectangle whose area is twice that of the triangle.
Area Once you know how to find the area of a triangle, you can determine the area of any polygon by subdividing the polygon into triangular regions.
Area Finding the areas of regions other than polygons is more difficult. The ancient Greeks were able to determine formulas for the areas of some general regions (principally those bounded by conics) by the exhaustion method. The clearest description of this method was given by Archimedes. Essentially, the method is a limiting process in which the area is squeezed between two polygons—one inscribed in the region and one circumscribed about the region.
Area Example: the area of a circular region is approximated by an n-sided inscribed polygon and an n-sided circumscribed polygon.
Area For each value of n, the area of the inscribed polygon is less than the area of the circle, and the area of the circumscribed polygon is greater than the area of the circle. Moreover, as n increases, the areas of both polygons become better and better approximations of the area of the circle.
Example 3 – Approximating the Area of a Plane Region Use the five rectangles below to find two approximations of the area of the region lying between the graph of f(x) = –x2 + 5 and the x-axis between x = 0 and x = 2.
Example 3(a) – Solution The right endpoints of the five intervals are , where i = 1, 2, 3, 4, 5. The width of each rectangle is , and the height of each rectangle can be obtained by evaluating f at the right endpoint of each interval.
Example 3(a) – Solution cont’d The sum of the areas of the five rectangles is Because each of the five rectangles lies inside the parabolic region, you can conclude that the area of the parabolic region is greater than 6.48.
Example 3(b) – Solution cont’d The left endpoints of the five intervals are (i – 1), where i = 1, 2, 3, 4, 5. The width of each rectangle is , and the height of each rectangle can be obtained by evaluating f at the left endpoint of each interval. So, the sum is
Example 3(b) – Solution cont’d Because the parabolic region lies within the union of the five rectangular regions, you can conclude that the area of the parabolic region is less than 8.08. By combining the results in parts (a) and (b), you can conclude that 6.48 < (Area of region) < 8.08.
Upper and Lower Sums Consider a plane region bounded above by the graph of a nonnegative, continuous function y = f(x). The region is bounded below by the x-axis, and the left and right boundaries of the region are the vertical lines x = a and x = b.
Upper and Lower Sums To approximate the area of the region, begin by subdividing the interval [a, b] into n subintervals, each of width Δx = (b – a)/n
Upper and Lower Sums The endpoints of the intervals are as follows. Because f is continuous, the Extreme Value Theorem guarantees the existence of a minimum and a maximum value of f(x) in each subinterval. f(mi) = Minimum value of f(x) in ith subinterval f(Mi) = Maximum value of f(x) in ith subinterval
Upper and Lower Sums Next, define an inscribed rectangle lying inside the ith subregion and a circumscribed rectangle extending outside the ith subregion. The height of the ith inscribed rectangle is f(mi) and the height of the ith circumscribed rectangle is f(Mi). For each i,the area of the inscribed rectangle is less than or equal to the area of the circumscribed rectangle.
Upper and Lower Sums The sum of the areas of the inscribed rectangles is called a lower sum, and the sum of the areas of the circumscribed rectangles is called an upper sum.
Upper and Lower Sums Below you can see that the lower sum s(n) is less than or equal to the upper sum S(n). Moreover, the actual area of the region lies between these two sums.
Example 4 – Finding Upper and Lower Sums for a Region Find the upper and lower sums for the region bounded by the graph of f(x) = x2 and the x-axis between x = 0 and x = 2 Solution: To begin, partition the interval [0, 2] into n subintervals, each of width
Example 4 – Solution cont’d Below2 shows the endpoints of the subintervals and several inscribed and circumscribed rectangles.
Example 4 – Solution cont’d Because f is increasing on the interval [0, 2], the minimum value on each subinterval occurs at the left endpoint, and the maximum value occurs at the right endpoint. Using the left endpoints, the lower sum is
Example 4 – Solution cont’d
Example 4 – Solution cont’d Using the right endpoints, the upper sum is
Upper and Lower Sums You are free to choose an arbitrary x-value in the ith subinterval, as in the following definition of the area of a region in the plane.
Example 5 – Finding Area by the Limit Definition Find the area of the region bounded by the graph f(x) = x3, the x-axis, and the vertical lines x = 0 and x = 1.
Example 5 – Solution Begin by noting that f is continuous and nonnegative on the interval [0, 1]. Next, partition the interval [0, 1] into n subintervals, each of width Δx = 1/n. According to the definition of area, you can choose any x-value in the ith subinterval. For this example, the right endpoints ci= i/n are convenient.
Example 5 – Solution cont’d The area of the region is