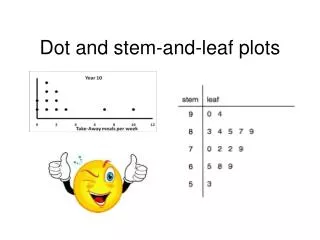

Dot Plot Stem-and-Leaf Plot
E N D
Presentation Transcript
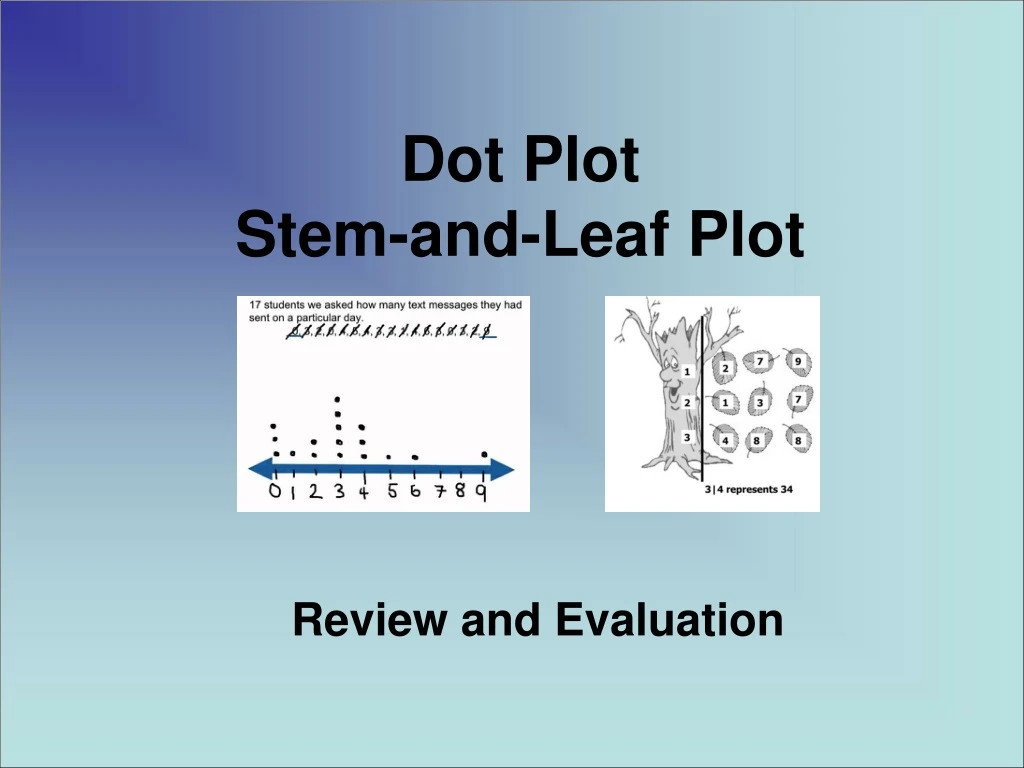
Dot PlotStem-and-Leaf Plot Review and Evaluation
What is a stem-and-leaf plot? • A T-chart that is used to show numeric data and the distribution of numbers
Why would I want to use one? • It displays a lot of numbers in a neater, cleaner, and organized way. • It makes it easier to see how spread out the numbers are.
Reading a Stem-and-Leaf Plot(how to analyze and make inferences)
Things you need to know… • Stems • The stems include the digits in the tens place and higher (sometimes the units place too, if data includes decimals) • The top of the stem includes all but the last digits of the smallest number • The bottom of the stem includes all but the last digit of the largest number • Your stems need to include ALL consecutive numbers in between—even if there is no data for it.
Things you need to know… • leaves • The leaves are always from the LAST digit from your data (usually ones place) • The leaves need to be organized from least to greatest • You can have multiples of the same digit per line (interval)
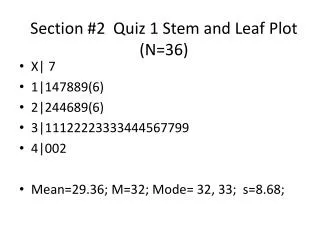
What does it look like? The stem-and-leaf plot below shows the number of students enrolled in a dance class in the past 12 years. The number of students are 81, 84, 85, 86, 93, 94, 97, 100, 102, 103, 110, and 111. 8 | 4 means 84
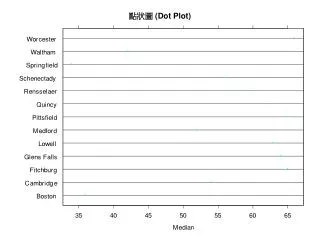
Should I skip numbers in my stem? You HAVE TO include all of the consecutive numbers from the first stem until the last one. Notice how 6, 7, and 10 have no data next to them. It means that no countries reported sixties, seventies, or one hundreds of infant deaths. You CANNOT put a zero in the leaf spot because that implies that you have data for that stem—which you don’t. No! This chart shows the number of infant deaths per 1,000 live births, of countries in Western Africa.
Definition A data display in which each data item is shown as a dot above a number line In a dot plot a cluster shows where a group of data points fall. A gap is an interval where there are no data items.
Evaluation Questions 1) Nicolas is saving his weekly chore money to buy a new bicycle. The amount of money Nicolas saved each week in dollars is 12, 24, 15, 22, 29, 10, 12, 11, 14, 31, and 16. Nicolas is making a stem-and-leaf plot of the data. What are the leaves for stem 1? A. 0, 1, 2, 2, 4, 5, 6 B. 1, 2, 4, 5, 6 C. 0, 1, 2, 4, 5, 6 D. 1, 2, 4, 9
Evaluation Questions 2) For how many weeks was Nicolas’ savings more than $20? A. 3 B. 4 C. 5 D. 11
Evaluation Questions 3) Which statement is best supported by the information in the stem-and-leaf plot? A 1/2 of the visitors were 40 or older. B Twice as many visitors were in their 40s than in their 20s. C 1/4of the visitors were in their 50s. D 1/8 of the visitors were younger than 40.
Evaluation Questions 4) Ms. Hernandez’s fifth grade science club had a bake sale where they sold 625 cookies. The number of cookies eight of the students sold is represented on the dot plot below. If the other two members sold an equal number of cookies, how many cookies did each one sell?
Evaluation Questions 5) Below is a dot plot showing the age of people that ate lunch at McDonalds. What is the difference of the total of people over 25 and the total under 25? AThere are four less people over 25 than under 25. B There are four more people over 25 than under 25. C There are thirteen more people over 25 than under 25. D There are equal numbers of people over 25 than under 25.