
SlideServe
Menu
Préférences
© SlideServe · v2026

Dot and stem-and-leaf plots

silas avatar
8 diapositives · 1.1K Views · Sep 19, 2014

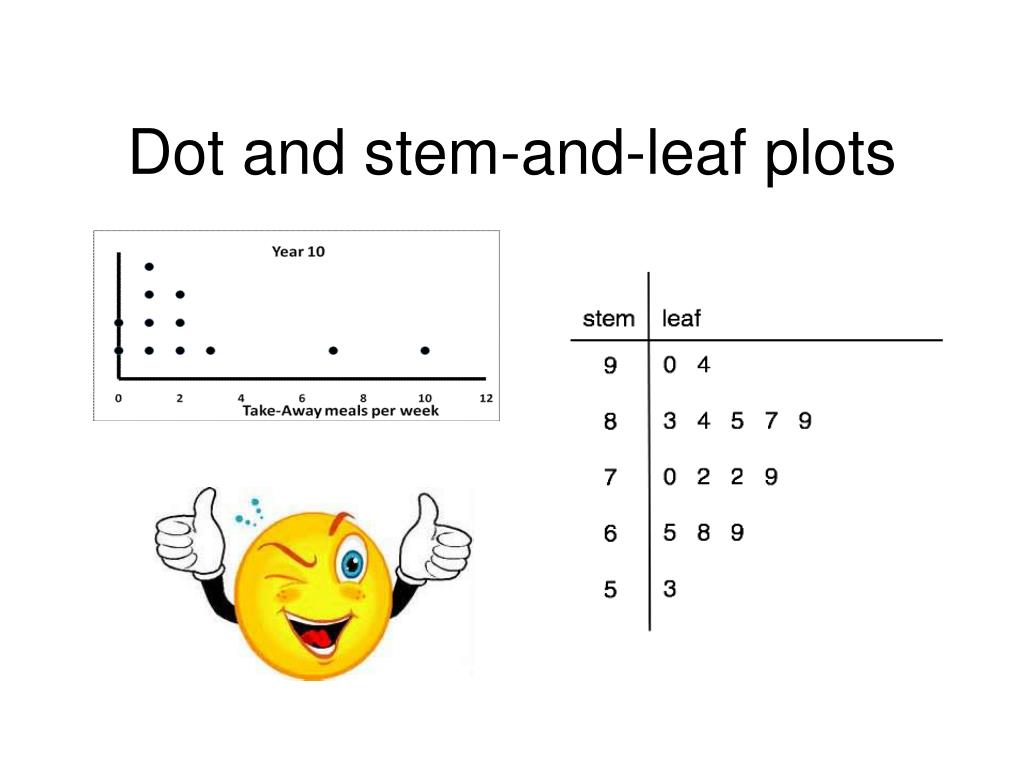
Dot and stem-and-leaf plots. Stem-and-leaf plots. A stem-and-leaf plot is a graph that shows the shape of the data according to the data place. How do you read stem-and-leaf plots The leaf is the last digit in the number. The stem is the remaining digit or digits to the left.
Dot and stem-and-leaf plots - slide 1
01 / 8Dot and stem-and-leaf plots
1 / 17

Télécharger la présentation

Dot and stem-and-leaf plots
Une image / un lien ci-dessous est fourni (tel quel) pour télécharger la présentation

Politique de téléchargement : le contenu du site vous est fourni TEL QUEL pour votre information et votre usage personnel ; il ne peut être vendu, concédé sous licence ni partagé sur d’autres sites sans l’accord de son auteur.Le contenu vous est fourni TEL QUEL, pour votre information et votre usage personnel uniquement. Téléchargez la présentation en cliquant sur ce lien. Lors du téléchargement, si vous ne parvenez pas à télécharger une présentation, l’éditeur a peut-être supprimé le fichier de son serveur.Pendant le téléchargement, si vous ne parvenez pas à obtenir une présentation, le fichier a peut-être été supprimé par l’éditeur.

F I N

Plus de contenu associé

Transcription de la présentation
  1. Dot and stem-and-leaf plots

  2. Stem-and-leaf plots • A stem-and-leaf plot is a graph that shows the shape of the data according to the data place. • How do you read stem-and-leaf plots • The leaf is the last digit in the number. • The stem is the remaining digit or digits to the left.

  3. How to make a stem-and-leaf plot • Make a stem-and-leaf plot for the following data set: 48, 49, 54, 55, 58, 60, 63. Step 1 Step 2 Step 3 Start of by making the stem. -Write the tens digits from least to greatest. Make the leaves by writing each ones digit in order to the right of its ten digit. Draw a line to separate the stems and leaves and label the plot. Stem Leaf 48 9 54 5 8 60 3 4 5 6 48 9 54 5 8 60 3

  4. Make a stem-and-leaf plot • Make a stem and leaf plot for the following data set: 95, 74, 68, 85, 86, 89, 72, 60, 88. 60, 68, 72, 74, 85, 86, 88, 89, 95 Stem Leaf 60 8 72 4 85 6 8 9 9 5

  5. Comparing two dot plots • The double dot plot compares the heights of girls in two different classes. What is an inference you can make from the dot plots? Girls in Mr. Sanson’s class are generally taller than the girls in Mrs. Kwei’s class. Girls in Mrs. Kwei’s class are generally shorter than the girls in Mr. Sanson’s class.

  6. Comparing two dot plots • The dot plot shows the height of males in females. What are two inferences you can make from the dot plots? Most men are between 64 and 74 inches tall. Most women are between 54 and 74 inches tall. Women have a larger range in height than men do. Most women have a 20 inch difference between then, where most men have about a 10 inch difference. Most women are shorter than men.

  7. Comparing two dot plots • The dot plot below shows the daily high temperatures of Springfield and Lake City for thirteen days. Compare the centers and variations of the two populations. • The center of Springfield is 81. • The center of Lake City is 84. • Based on the center points of the dot plots, what is an inference you can make about the temperatures of these two cities? Based on the center being more in Lake City than Springfield, the temperature is generally higher in Lake City.

  8. Make a stem-and-leaf plot with the following data, and find the mean, median, mode and range. • 78, 67, 54, 46, 77, 65, 53, 43, 75, 64, 52, 40, 51, 62,and 50 Median = 54 Mean = 877 ÷ 15 = 58.4666… = 58.5 Mode = none Range = 78-40 = 38 Stem Leaf 40 3 6 50 1 2 3 4 62 4 5 7 7 5 7 8