Inflation
Inflation. Chapter 7. Chapter Overview. 1. What is Inflation? 2. Redistributive Effects of Inflation. 3. Macro Consequences. 4. Measuring Inflation. 5. The Goal: Price Stability. 6. The Historical Record. 7. Causes of Inflation. 8. Protective Mechanisms. 1. What is inflation?.

Inflation
E N D
Presentation Transcript
Inflation Chapter 7
Chapter Overview • 1. What is Inflation? • 2. Redistributive Effects of Inflation. • 3. Macro Consequences. • 4. Measuring Inflation. • 5. The Goal: Price Stability. • 6. The Historical Record. • 7. Causes of Inflation. • 8. Protective Mechanisms.
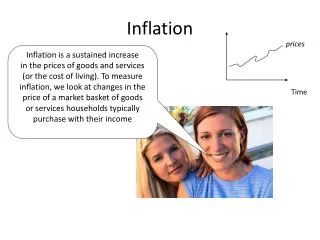
What Is Inflation? • Inflation: • an increase in the average level of prices, • not a change in any specific price. • Deflation: • a dropin the average price level.
Relative Prices vs. the Price Level • Relative price: • the price of one good in comparison with the price of other goods. • Changes in relative prices are keysignals in the market mechanism: • They direct producers on how to allocate resources… • …and also direct consumer buying decisions.
Relative Prices vs. the Price Level • However… • general inflation: • obscures and confusesrelative price relationships; • inhibits the efficient reallocation of resources in the economy.
Redistributive Effects of Inflation • Not all prices rise at the same rate during inflation: • People are hurt or helped by three redistributive effectsof inflation: • Price effects. • Income effects. • Wealth effects. LO2
Nominal vs. realincome • Redistribution from priceeffects: • rooted in nominal vs. realincome: LO2
Nominal vs. realincome • Nominal income: • income received in a given time period, measured in current dollars. • Real income: • income in constant dollars; • (nominal income adjusted for inflation). • Nominal income can rise even as real income isfalling. LO2
Price Effects • Not all prices rise at the samerate during inflation. • Those who consume goods & services that are rising fastest in priceare hurt the worst: • Theirreal income falls faster. LO2
Price Changes in 2006 • (pg. 127, Table 7.2) LO2
Income Effects • Rising prices = rising incomes, …but ... • … like prices, incomesdo not all rise at the same rate. LO2
Income Effects • Income Effect: • People whose nominal incomes rise more slowly than the rate of inflation end up worse off.
Income Effects • Incomesufferers of inflation include fixed-income groups: • Retirees (“fixed incomes”). • workers locked into long-term contracts. • lenders. • Income winners: • nominal income rises faster than average prices. (Inflation = weaker dollars)
Nominal Wages and Prices • (pg. 128, figure 7.1) Productivity increases = Wages up faster than prices. Fringe benefits & payroll taxes increases = Wages up more slowly than prices. LO2
Wealth Effects • Winners and losers from inflation depend on the form of wealth they own. • You lose when inflation reduces the real value of wealth, and vice versa. • Example: • your savings account pays 2% interest… • inflation is running at 5%. LO2
The Real Story of Wealth • (pg. 128, Table 7.3) LO2
In Summary: Redistributions • The redistributive mechanics of inflation include: • price effects, • income effects, • and wealth effects. • Inflation acts like a tax, taking income or wealth from one group and giving it to another. LO2
Other Effects of Inflation: • Social Tensions: • labor and management, • government and the people, and … • amongconsumers. • The societal tensions of extreme and persistent inflation can overwhelm a society and its institutions. LO2
Effects: Money Illusion • Money illusion: • The use of nominal dollars rather than real dollars to gauge changes in one’s income or wealth. • Money illusion distorts one’s perception of the current state of prices and the market. LO2
Uncertainty • Economic decisions, especially long-term planning,become more difficult. • “Time horizons” are shortened: • people spend money before it loses more value. • Businesses hold off on investment. • This uncertainty can hinder economic activity and growth.
Speculation • Few people will engage in actual production if it is easy to make speculative profits. • Such speculation may fuel hyperinflation. • Hyperinflation: • an inflation rate in excess of 200 percent, lasting at least one year.
Bracket Creep • Bracket creep is the movement of taxpayers into higher tax brackets (rates) as nominal incomes grow.
Deflation Dangers • Deflation occurs when the price level falls. • Deflation reverses the redistributions caused by inflation: • fixed income recipients gain. • lenderswin and creditorslose.
4. Measuring Inflation: • The CPI – Consumer Price Index • Using the CPI. • Construction of the CPI. • Other measures of inflation.
Consumer Price Index (CPI) • The consumer price index(CPI): • a measure (index) of changes in the average price of consumer goods and services. • It is used to calculate the inflation rate. LO1
Consumer Price Index (CPI) Nominal to Real GDP Year 1997 1998 1999 2000 2001 2002 2003 2004 2005 CPI GDP Deflator 89 92 96 100 101 104 111 118 126 Nominal Income 48,000 49,200 49,900 51,000 52,300 53,200 54,800 56,100 57,900 Nominal increase 1,200 700 1,100 1,300 900 1,600 1,300 1,800 Real Income 53,933 53,478 51,978 51,000 51,782 51,154 49,369 47,542 45,952 Real Change -455 -1,500 -978 782 -628 -1,785 -1,827 -1,590 BONUS QUESTION (that you need to know how to do): Rate of inflation from 2001 to 2002? 2.97% (not 3%) The Change The Starting Point Rate of inflation from 2002 to 2003? 6.73% (not 7%)
Constructing the CPI • A “market basket” of goods:” • Bureau of Labor Statistics. • 184 goods and services. • A base period is chosen for indexing. LO1
Constructing the CPI • The CPI is a weighted average: • The relative importance of a product in the CPI is reflected by its item weight. • Item weight: • the percentage of total expenditure spent on a specific product: LO1
The Market Basket Transportation 18.0% Housing 32.7% Food 13.7% Insurance and pensions 11.2% Clothing 4.1% Miscellaneous 9.5% Entertainment 5.1% Health care 5.7% • (pg. 132, figure 7.2) Item Weight % of total household spending LO1
Constructing the CPI • The impact on the CPI of a price change for a specific good is calculated as follows: %∆ in item price percentage change in CPI item weight x = LO1
Calculating Price Change Impacts on the CPI • (pg. 133, Table 7.4) %∆ in item price percentage change in CPI item weight x =
The Market Basket Transportation 18.0% Housing 32.7% Food 13.7% Insurance and pensions 11.2% Clothing 4.1% Miscellaneous 9.5% Entertainment 5.1% Health care 5.7% Affect on the CPI Housing ↑ 10% = Transport ↑ 5% = Food ↓ 3% = (All else unchanged) 3.27% 0.9% -0.411 %∆ in CPI = 3.759% LO1
Practice: • “Problem sets” @ back of book: • #5 & #6.
Other gauges of inflation: (Variations on the CPI): - The core inflation rate - PPIs - The GDP deflator
The Core Inflation Rate • Core inflation rate: • the CPI excluding changes in food and energy prices. • a more accurate monthly reading of consumer price trends. LO1
Producer Price Indexes • Three producerprice indexes(PPI): • They track average prices received by producers. • crude materials, • intermediate goods, • finished goods. LO1
Producer Price Indexes • Produce Price Indexes and the CPI: • PPIs and the CPI generally run equal in the long run. • PPIs lead the CPI in the short run: • ***They act as an early indicator of changing price levels.
The GDP Deflator: • The broadest price index is the GDP deflator. • The GDP deflator is a price index that refers to all goods and services included in GDP (C+I+G+X-M). • Unlike the CPI and PPI, it is not limited to a fixed basket. • Its value reflects both: • price changes, and … • market responses to those changes (quantity/proportion changes). • ***This usually results in the GDP deflator understating inflation in comparison to the CPI LO1
5. The Goal – Price Stability • Employment vs. inflation. • Problems with the CPI.
The Goal: Price Stability • Every U.S. president since Franklin Roosevelt has decreed price stability to be aforemost policy goal. LO3
A Numerical Goal • Price stability: • the absence of significant changes in the average price level; • FullEmployment and Balanced Growth Act (1978): • Officially defined price stability as: • an inflation rate < 3 %. LO3
Unemployment Concerns • Full employment: • the lowest rate of unemployment consistent with stable prices. LO3
Unemployment Concerns • Price stability is balanced against the desire to avoid unemployment and declines in production. LO3
Problems with CPI • The CPI is not a perfect measure of inflation: • an increase in price may be caused by quality improvements of products. • The comparison of an equal basket of goods over time… …turns into a comparison of unequal baskets of goods. LO3
New Products • The CPI is also biased upward when new products whoseprices are falling are left out of the market basket. • These are additional reasons not to set a goal of 0% inflation. LO3