Download

1 / 46
460 likes | 588 Vues
Growing Agriculture In a Watershed Way. Protection, Preservation and Enhancement of the Kickapoo River Valley Through Biomass Processing. Live & Learn…. Watershed Contributions to Water Pollution. Pictures of water pollution removed to reduce size.

E N D
Growing Agriculture In a Watershed Way Protection, Preservation and Enhancement of the Kickapoo River Valley Through Biomass Processing
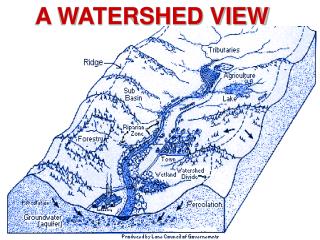
Watershed Contributions to Water Pollution Pictures of water pollution removed to reduce size.
All activities within a watershed have an impact Agricultural pursuits can co-exist with improvements in water quality It’s all about the biomass… Why Watersheds?
What Is Biomass? • Biomass is plant material and animal waste used to produce energy • It is the oldest form of renewable energy known to humans • The energy of biomass comes directly from the sun
Plants store the sun’s energy like batteries When these materials are combusted they release that energy Biomass is a sustainable and clean source of renewable energy What Is Biomass?
Biomass can be used as feedstock to fuel processes that create renewable energy OR biomass can be allowed to decompose in area lakes and streams Examples of Biomass
We Take Great Care to Preserve Our Soil… • We need to take additional care in extracting the value out of our biomass rather than treating it as a waste
Cashton Greens Energy Park On Site: • Bio-Refinery to produce green energy and marketable products • Bio-Diesel processing & fueling • Two (2) Utility scale wind turbines • Cow manure and tallow as feedstock for bio-refinery • Tenants will be users of the energy created on site
Attracting Our First Tenant • Organic Valley Family of Farms • Goal: Build a new warehouse & UHT plant (2006 & 2011) • Opportunity: Use renewable energy as fuel • Large water and wastewater needs
Wind energy could provide “green” and renewable electricity A wind study has been completed and the site can support 2 wind turbines Renewable Energy
Cashton Greens Energy Park • The “green energy” park will produce and consume renewable energy to support manufacturing, transportation, distribution and other activity that is important to the community. • We strive to be climate neutral in all we do. • We promote moving from an “oil-centric” to a “bio-centric” economy
Wisconsin Specific Energy Needs • Wisconsin has no fossil fuel deposits. As a result, 97% of the state’s energy sources are imported. • In 2003, the state spent $13.8 billion on energy, which was approximately 8% of the state’s economy. • On a per household basis, that is a trade deficit of approximately $4,100 due to energy purchases
Phase 1: Manure from ~ 725 bulls managed entirely through Cashton Greens as feedstock Significant cost avoidance Upside potential for innovative partnership Early adopter Feedstock: Accelerated Genetics
Feedstock: Dairy Producers • We are working with area dairy farmers to understand the advantages of managing their manure regionally as Phase II • State of Wisconsin could provide impetus for manure management changes • Manure management task force and Governor’s consortium on bio-industries help strengthen our position
Potential Uses of Char • Agricultural • Soil additive which stabilizes the soil, improves resistance to erosion, increases permeability to air and water, improves texture and resistance of the surface to crusting, eases cultivation and improves soil quality • Filter Media • Activated carbon filtration media for wastewater treatment systems • Fuel • Pelletized fuel product
Complimentary Bio-Diesel Production • Production of bio-diesel running 24 hour days • Plant could be run on low and high grade tallow • Low RPM marine diesels run on bio-diesel to create electricity and heat • Waste heat used to pre-heat dryer for pyrolysis process • Integrated bio-diesel production and pyrolysis process yields further benefits
Goals of Renewable Energy ParkGrow Wisconsin Dairy • Improve water quality of receiving streams by removing input of manure in runoff from landscape • Move away from the one cow : two acre land spreading rule by managing manure to capture value • Converting the nutrients from manure into a readily stored and transportable form allows the nutrients to be removed from the watershed
Implications for Wisconsin • Investment by the State of Wisconsin in a manure management system that solves the manure problem rather than moving it around • Gives producers an alternative to land spreading and disposing waste bio-mass especially during the winter months • Renews Wisconsin’s reputation as the leader in the dairy industry with world wide opportunity while protecting our watersheds
Growing Agriculture In a Watershed Way Thank You Steve Hansen Contact: Valley Stewardship Network 637-3615 Protection, Preservation and Enhancement of the Kickapoo River Valley Through Biomass Processing
Release: 5/31/05 NEWS RELEASE: JOINT AGENCY TASK FORCE NAMED TO ADDRESS MANURE MANAGEMENT ISSUES MADISON— A statewide effort to protect streams, lakes, and drinking water supplies from manure contamination will be led by a task force jointly appointed by the Departments of Agriculture, Trade and Consumer Protection and Natural Resources. A number of recent manure runoff events have resulted in fish kills, and in some cases, contamination of drinking water supplies. “These incidents are not acceptable and solutions are needed for farmers across Wisconsin,” stated Rod Nilsestuen, state agriculture secretary. “I am concerned about the more than 30 manure runoff incidents this year,” said Scott Hassett, DNR Secretary. “But I am confident that this task force will offer innovative manure management practices that will support clean water, healthy fisheries and prosperous farms.”
Manure in Wisconsin • The average 1400-pound dairy cow consumes 48 lb of dry matter per day, of which 66% is digested in the rumen. • When combined with fluids consumption, this results in 148 pounds of manure each day or 27 tons per year (17.7 gal/day, 6500 gal/year) as excreted from the cow (UWEX, 2003).
Improperly Managed Manure Leads to Pollution • A correlation between eutrophication and P concentration in runoff and soil exists (Sharpley, 1995). Algae growth promoted by P and N availability in local water bodies can deprive the water systems of oxygen needed for respiration by the fish and aquatic community. • There is now a significant body of evidence to suggest that: (i) P from agricultural sources can represent a significant input to fresh water and (ii) the increase in P concentrations in agricultural drainage water over time reflects the accumulation of P in soils (Sharpley, 2000b).
Improperly Managed Manure Leads to Pollution • Land application of dairy manure is receiving extensive investigation because of the over-supply of nutrients, especially P on the farm and especially near the livestock housing (Converse, 2002; Gale, 2000). • The over-supply of P is the result of excessive spreading of manure because of close proximity to the livestock production facilities. Results from Gale (2000) indicated that the potential for P to move through runoff increased as the manure application rate increased in manured soils. • Heckrath et al. (1995) found that soil test P (Olsen P) greater than 60 ppm in the plow layer of a silt loam caused the dissolved P concentration in tile drainage water to increase dramatically (0.15 to 2.75 mg/L). • They postulated that this level (60 ppm), which is well above that needed by major crops for optimum yield, is a critical point above which the potential for P movement through water infiltration and ground leaching greatly increases.
Wisconsin Manages Manure • The State of Wisconsin has formed a strategy to address some of the pollution concerns with the dairy industry. • The State has focused on manure management as the major environmental pollution concern for the dairy industry. • These concerns are (apparently) being addressed by the introduction of Nutrient Management Plans (NMP) on farms. • Guiding documents for developing nutrient management plans, the USDA-NRCS 590 Standard, were created in 1991-1992 by a multi-agency working group (Erb, 2000).
Phosphorus Index • The following bullets highlight some of the restrictions that are proposed for the new standards (WI-1, 2002). • The landowner/producer is responsible for keeping records of all the component of the nutrient management plan for a minimum of four years, as well as having the plan updated annually. The plan should include a general operation overview, summary of nutrient sources, and a general summary of phosphorous reduction strategies. • Individual fields must be detailed for nutrient management using the Phosphorous Index (PI) management strategy. • Where soil test P values are restricted due to exceeding concentrations of P <50 ppm soil test P: nutrient application rates allowed up to the N needs of the following year’s crop or the N removal for the following legume crop. • 50-100 ppm soil test P: P application shall not exceed total crop P removal for crops to be grown in the rotation (maximum 4 years). • >100-ppm soil test P: eliminate P applications, if possible. If applications are necessary due to special circumstances, applications shall be less than annual crop removal.
Phosphorus Index • Since crop need for N is three to four times higher for most crops than the need for phosphorus (while manure nitrogen concentrations are only double phosphorus concentrations), excess phosphorous is deposited in the soil (Erb, 2000). • The nitrogen based loading limit has allowed the land application of P to be nearly double the necessary crop phosphorous uptake.
Phosphorus Index • Switching the manure loading rate from N based to P based loading would have a dramatic effect on the acreage of land needed for land application of manure. • From a P management perspective, applying manure to meet P removal would increase the total land acreage necessary for manure application by 130%, (Erb, 2000). • Not only must increased acreage be accounted for, but increased manure handling, hauling, and added fertilizer N costs must also be considered.
The Impact of Lagoons • Lagoon storage and anaerobic digestion often result in the seasonal land spreading of the manures under controlled rates. However, these processes do little in removing or reducing nutrients, especially P, from the waste stream. In the case of many Wisconsin dairies, phosphorus accumulations could be reduced 90% by changing management practices. These include reducing dietary phosphorus in purchased supplements, and applying manure to other fields (Erb, 2002).
Total Dissolved Solids Removal • Chastain (2001) analyzed the affects of polymers on manure settling at Sunny Dairy in Missouri. During the process a polymer, polyacrylamide (PAM), was added to the effluent in the two-stage separation process. First, manure was processed normally by using an inclined screen; the PAM was added to the effluent prior to settling. The separator effluent after a 60 minute mixing period with 300 mg PAM/L removed 76.1% total solids, 92.6% total suspended solids, 80.3% volatile solids, 80.8% COD, 45.7% of the TKN, 72.3% of the Organic-N, and 61.8% of the phosphorus. Chastain surmised that the PAM addition could be a substitute for the lagoon settling
Total Dissolved Solids Removal • Chastain also found that alum was effective in the place of PAM. Alum was very effective for enhancing the settling of the effluent from the inclined screen separator. The defined two-stage separation process that substituted 3,194 mg alum/L for PAM removed 89.1 % TS, 99.7% of the TSS, 85.6 % of the VS, 96.0% of the COD, 74.4% of the TKN, 93.0% of the organic-N, and 99.6% of the TP.
Manure Management Costs • The baseline for Flushing Farms is the net daily revenue if landspreading. Under these conditions, the baseline net daily revenue is ($555.60) per day. That is, the average daily cost of lagooning and landspreading the manure without solids separation treatment is an estimated $555.60 per day. This results in an annual manure landspreading cost of $202,794.
Manure Management Costs • Due to the characteristics and reduced flow of scraping farms, the baseline cost of landspreading is reduced $255.60 per day, $300.00 per day less than the cost of landspreading under flushed conditions. The annual manure landspreading cost Scraping Farms is $93,000.