Download
1 / 47
470 likes | 638 Vues
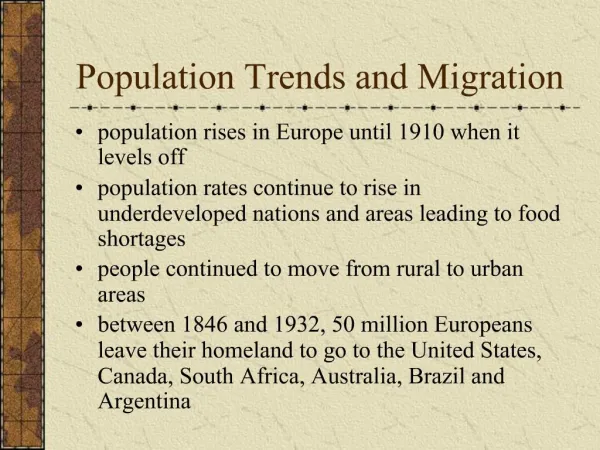
Analyzing Population and Migration. Basic Population Statistics. Birth Rate Death Rate Rate of Natural Increase(RNI) Doubling Time Demographic Equation Total Fertility Rate Replacement Rate. Birth Rate. Also called crude birth rate or CBR Annual Statistic

E N D
Basic Population Statistics • Birth Rate • Death Rate • Rate of Natural Increase(RNI) • Doubling Time • Demographic Equation • Total Fertility Rate • Replacement Rate
Birth Rate • Also called crude birth rate or CBR • Annual Statistic • Measures the total amount of infants born living in one calendar year • This number is divided by 1,000 to receive a small integer number for the birth rate • The 1,000 represents 1,000 members of the population • This makes the data easier to work with. Birth Rate Formula: Live Births Population/1,000
More Info on Birth Rate • High birth rates (18-50) are found in rural LDCs with economies based on agriculture • Low birth rates (8-17) are found in urbanized MDCs
Death Rate • Also called crude death rate or CDR • Annual statistic • Calculated the same way the birth rate is Death Rate Formula: Deaths Population/1,000
More Info on Death Rate • A high death rate can show whether a country is experiencing war, disease, or famine • LDCs typically have a high CDR due to a combination of poverty, epidemics, and a lack of medical care • These lead to a low life expectancy, which results in a higher death rate • However, thanks to the Green Revolution, hygiene, health care, and life expectancy have increased resulting in lower death rates in LDCs
The Rate of Natural Increase • Rate of Natural Increase(RNI) • Sometimes referred to as the natural increase rate(NIR) • The RNI is the annual percentage of population growth of that country for a one-year period • Includes % sign in answer Rate of Natural Increase Formula: Birth Rate – Death Rate 10
Negative RNI • It is possible to have a negative RNI if the death rate is more than the birth rate • If an RNI is negative, that means that the population in that country has decreased during that year it was measured • RNI is negative if an event such as a natural disaster has occurred or vicious epidemics hit the country • EX: Haiti(2010)- RNI: -7.39% • Reason: 2010 Earthquake in Haiti
Shrinkage in RNI • Another explanation of a negative RNI is in MDCs that are highly urbanized and where their role of women in society is improving. • If a woman is engaged in business, political activity, or urban social networks, she is less likely to have children • Double-income no-kid(DINK) households are more common as well as single parent-single child homes
A Flaw in the ‘Natural’ Increase • Does not account for immigration or emigration • A country with a high RNI can have a low long-term population if there is a large amount of emigration • A country with a low RNI could grow if there was high immigration • Statistics state that new immigrant populations have much higher fertile rates than the general population already living in the country • EX: The United States; population growth isn’t necessarily from immigrants crossing the border, but the fact that they will have children in the United States after they have settled
Doubling Time Doubling Time Formula: 70 Rate of Natural Increase • This formula is considered an estimate since emigration is not taken into consideration when calculating the RNI • Without accounting for emigration, population would be lower than actually predicted
The Net Migration Rate Net Migration Rate Formula: (# of Immigrants - # of Emigrants) Population/1,000 • This statistic can be negative due to push factors such as disease
Total Fertility Rate • TFR • An estimated number of children born to each female of birthing age (15-45) Total Fertility Rate Formula: Number of Children Born Women Aged 15 to 45 • Not an annual statistic • Can’t have a negative TFR
The Replacement Rate • The Replacement Rate of a TFR is 2.1 • 2 Parents to replace themselves=2 kids • Why the .1? • Called “error factor” • Some part of the population will die before reaching adulthood • Epidemics • Accidents
The Demographic Transition Model • A theory of how population changes over time • Provides insight into migration, fertility, economic development, industrialization, urbanization, labor, politics, and the roles of women • Mapping countries on the model gives info about their economy, migration, population, and even their quality of life • Mapped lines are theoretical estimates and averages • A country’s data cannot exactly follow the average statistics
Predictions • The DMT (Demographic Transition Model) can be used to predict a country’s growth over the years • Can also be used to predict world growth(early stage three) • We are able to approximate a population projection that approximates that the earth’s population is only 2/3rds full • Once global populations stabilize in stage four, global population will be around 10 billion people
NICs • Newly Industrialized Countries • Include BRICs- Brazil, Russia, India and China • Turning point from agricultural economy of stage two to the manufacturing-based economy of stage three • Theoretical model • China does not follow this model with their one-child policy • This makes them seem more advanced than other NICs
MDCs • More developed countries • Includes United States, Great Britain and Germany • Birth rate of 11 and a death rate of 10 • Very little growth
S-Curve of Population • Any population given enough food and protection will experience a rapid population growth followed by a plateau or decline due to a population reaching or exceeding the area’s carrying capacity • Human population may reach equilibrium in the global habitat
Stage 1 • Pre-Agricultural Societies • Subsistence farming and transhumance • Transhumance- the seasonal migration for food and resources or owning livestock • CBR and CDR fluctuate • Climate, warfare, disease, and ecological factors affect these rates • Birth and Death Rates are high • Little population growth until the later part of stage one when death rates start to decline • RNI is generally low • Can be negative during epidemics
Stage 1- Births and Deaths • Children were an expression of a family’s productivity and status • More kids = more work gathering crops, hunting, etc.. • Child Mortality and Infant Mortality is high • Motivated parents to have a few extra children just in case some died • Very low life expectancy • Lack of modern medicine and health care, limited sanitation, low nutritional standards, and warfare contribute to low life expectancy and high death rate • Hard physical labor and constant migration wore down the body and decreased life span
Stage 2 • Typically agriculture-based economy • Commercial agriculture as opposed to subsistence agriculture • Birth rates remain high while death rates decrease • RNI goes up significantly
Stage 2- Births and Deaths • Compared to stage one, children are even more important as a source of labor • Commercial agriculture = profit. More children=more farm work=more crops= more profit • Child mortality is still high due to lack of health care and poor nutrition • Majority of population lives in rural areas • Seasonal migrations become less common= lower death rate • Improved farming techniques; domestication of animals also reduces death rates • Expanded trade of agricultural goods brings a larger and more varied food supply • Increase in food volume, year-round availability, and nutrient quality provides for longer life spans
Stage 3 • Industrialized or manufacturing-based economies (secondary economic activities) • Shifted economics to a more service-based focus • Completes the S-Curve and moves to stage 4
Stage 3- Births and Deaths • Birth Rates Decrease • Effects of urbanization, increases in health care, education, and female employment result in less fertility • Women’seducation and increased employment results in less children because of school and job commitments • Death Rates • Access to health care, better nutrition, and education lower death rates • Death rates eventually bottom out • Life expectancies can increase in stage 3, but the death rate eventually bottoms out during stages 3 and 4
Stage 4 • Birth and Death Rates converge to result in limited population growth and even population decline • MDCs with service-based economies • Services such as finance, insurance, real estate, health care, and communication drive the economy • Decreasing manufacturing • EX: In the US, services are 80% of the GDP and manufacturing is a mere 17% • Highly urbanized countries with the longest life expectancies, sometimes averaging over 80 years
Stage 4- Births and Deaths • Birth Rates bottom out • High degree in access to medical care • Roles of women in society increase, therefore less time to have children • When birth rates reach the same as death rates there is a zero population growth(ZPG) and an RNI of 0.0% • Birth rates can decline until they are less than death rates, and this causes a population decrease and a negative RNI • Death Rates remain low • Vary slightly based on the age of the overall population • Younger average age will result in low death rates, and a higher average age will result in slightly higher death rates
Stage 4 • Incentives are offered in countries that are near or below zero population growth levels • Small number of children = less of a future work force; this is why they offer incentives- greater work force • Many of these countries have depended on foreign guest workers, like the gastarbeiter in Germany • These workers usually come from countries such as Turkey, North Africa, the Middle East, and more recently, the former Soviet Union
Malthusian Theory • Thomas Malthus published An Essay on the Principle of Population in 1798 • Predicted that the global population would one day expand to the point where it could not produce enough food to feed everyone • Why this idea? • UK was engaged in the Industrial Revolution and people were being born at a high rate • Britain was moving from stage two to stage three on the DTM • Malthus saw massive migration to the cities and enormous population growth
Mathematically • Malthus saw that food production grew over time, but slowly linear • Meanwhile, human population grows exponentially • Population is the J-Curve of exponential population growth
What Happened, Instead? • Agricultural technology was going to boost food production in multiples in the 1800s • By 1900, inventions such as the internal combustion engine, artificial fertilizers, pesticides, irrigation pumps, the tin can, and the refrigerator would increase food production/storage • A large volume of food would be added to global production and supply • Food production has continued to stay ahead of population growth
Neo-Malthusians Three Important Points • Sustainability- When the world does reach 10 billion people, there may be problems keeping up with food demand over the long-term • Many agricultural regions already have significant ecological problems • Soil erosion and soil nutrient loss and in arid regions, depletion of irrigation sources and soil salinization • Increasing Per Capita Demand- The amount of food consumed per person is increasing • MDCs consume around eight times more the amount of food and resources that a LDC consumes • As more LDCs develop, more food and resources will be consumed • Natural Resource Depletion- Theorists like Paul Ehrlich have also warned about our over-consumption of other resources such as timber, minerals, energy, and other nonrenewable resources • We need to conserve and look for alternatives so that we can stretch out supplies over time
Gaps and Busts External War Baby Bust or Epidemic
The Top • Elderly Citizens • Increased mortality and old age cause a significant decline in elderly population • Male side of the pyramid decreases quicker than the female side • Females live on average 4-5 years longer than males
Population Density • Two main ways to calculate population density • Arithmetic density is the number of people per square unit of land • Most island nations and microstates have extremely high arithmetic densities • Other countries that are known for their high arithmetic densities are India, Bangladesh, Japan, and South Korea • Physiologic density is the number of people per square unit of farm land • More practical tool in understanding the sustainability of a population of a certain region or country • Limits can include overcrowding on farms or lack of abundant farming regions due to geography
Center of Population • Can be found be averaging the spatial weight of population across the country • In the US, the population center has continuously moved west each decade since the first census in 1790 • Originally, land in the Eastern United States was already owned and farm populations were high • Because of this, people who wanted their own land were forced to migrate westward in order to start their own farms • During WWII, arithmetic density and population center moved westward • After WWII, population shifted South and West due to the Sunbelt Migration
Population and Sustainability • Across the ecumene, the living space of humans on the earth’s surface, there are certain limits to how many people an environment can support • Some regions support human settlement better than others • EX: Grasslands can support more people than deserts • More people are moving into arid regions. Dry regions will eventually lose sustainability, but we cannot predict when • Overpopulation is a concern for all regions • Certain resources such as clean water, endangered plant and animal habitats, and nonrenewable energy sources like oil will be depleted • Many theorists have expressed a desire for large-scale family planning and contraceptive programs • These ideas are generally rejected based on religious beliefs • If there is overpopulation, personal space will decrease and this can cause social unrest and armed conflicts • To achieve sustainable resources for use in the coming decades, global programs that enforce recycling, energy conservation, farming practices, and a reduction of personal consumption are believed to be necessary
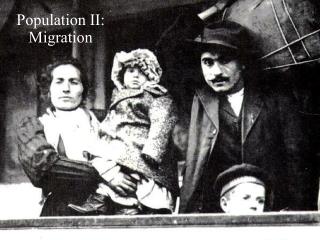
Migration • Many different types • Inter-regional or internal migrants move from one region of the country to another • EX. Rural-urban migrants • Intraregional migrants move from one area to another within the same region • Transnational migrants are people that move from one country to another
Migration • General voluntarily, but there are forced migrations • People that are forced to move by war, disasters, or fear of government repression are known as refugees • Some countries have programs to receive refugees from other countries and grant them asylumtemporarily or even permanently • Host countries face economic burdens from supporting extra people • Basic nutritional and sanitation needs are barely met if the host nation is a developing nation struggling to provide for its own people • People seeking refuge that do not have government authorization are viewed as illegal immigrants • Some countries have amnesty programs allowing illegal immigrants the opportunity to apply for official citizenship without facing arrest or deportation
Various Migrations • Step Migrations are when people move up in a hierarchy of locations, with each move to a more prosperous location • Intervening opportunities for work and economic improvement will increase the migrant’s distance traveled. Also intervening obstacles. • Chain Migrations are when a pioneering individual or group settles to a new place, establishing a new migrant threshold • The pioneer provides information on employment opportunities, access to markets or social networks, and encourages others to migrate to the location • More and more people move and a growing immigrant community is started
Cyclic Movements and Remittances • Migrants who migrate purely for employment purposes have a cyclic movement from place to place • For transnational labor migrants, foreign employees work for a limited period of time before returning to their home country • This is sometimes called periodic movement if it is on an annual or seasonal basis • EX: agricultural workers coming from Mexico to the US for different harvest periods, then coming home to return to their harvest on family farms • The receiving country benefits from the inexpensive labor into their economy • Socio-economic cost of receiving this flow of immigrants includes crime, unemployment, the social welfare burden, and national security concerns • The loss of skilled workers in sending countries poses a problem (brain drain) • The largest positive economic effect of migration is the sending of remittances • Remittances are monetary and other cash transfers sent from transnational migrants to their families and communities back home • Remittances create a positive impact in the migrant’s home country
Push and Pull Factors • NICs experience rapid internal rural-to-urban migrations • Employment at urban manufacturing locations seems to be the main intervening opportunity for internal immigrants • Push Factors are things about the rural agricultural landscape and livelihood that force people out of the farms • Pull Factors are things about cities that draw people to the urban landscape • The opposite of a pull factor is NOT a push factor
Examples • Push Factor: Armed Conflicts • When conflicts emerge in rural areas, many people flee and become refugees to the safety of cities • Push Factor: Environmental Hazards • Over usage of agricultural chemicals can poison soils and water supplies • Improper use of pesticides can lead to birth defects in children • Natural Disasters are also push factors • Push Factor: The High Cost of Land • In NICs, land prices increase • Farmers who have owned land may have the opportunity to sell their land for more money than several years of harvests. This money could be used for migration • Pull Factors • Mainly employment related • Pull of Services such as medical care or education are also substantial pull factors. Media can also be used as a pull factor • Clean water is not considered as a pull factor since there are cases where the rural population has less contaminated water than the urban population