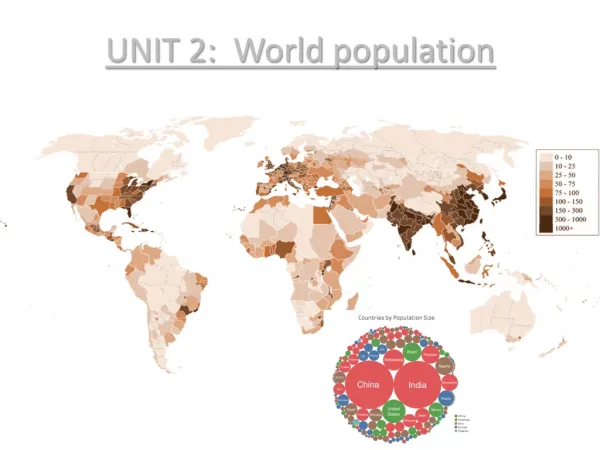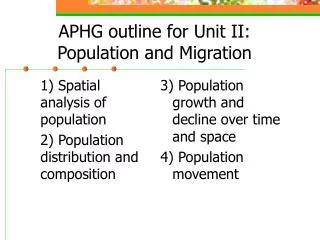
Understanding Population Dynamics: Importance of Studying Demography and Migration Patterns
This unit explores the critical significance of studying world population and migration trends. It covers essential concepts like absolute and relative locations, types of maps, and geographic information systems. Key demographic indicators such as crude birth rate (CBR), crude death rate (CDR), and natural increase rate (NIR) help assess population changes and overpopulation risks. It emphasizes population concentrations and sparsely populated regions, examining how fertility and mortality rates affect growth. Policy implications, such as China's one-child policy, provide insights into managing population dynamics.

Understanding Population Dynamics: Importance of Studying Demography and Migration Patterns
E N D
Presentation Transcript
Reference Maps Show locations of places and geographic features Absolute locations What are reference maps used for? Thematic Maps Tell a story about the degree of an attribute, the pattern of its distribution, or its movement. Relative locations What are thematic maps used for? Two Types of Maps:
Geographic Information System: a collection of computer hardware and software that permits storage and analysis of layers of spatial data.
Reliability of Population Data, Fertility/Mortality/Birth rate Precursor to Demographic Transition Model
Population Change Measured: • Crude Birth Rate (CBR) • Crude Death Rate (CDR) • Natural Increase Rate (NIR)
Crude Birth Rate: CBR • Total number of live births in a year for every 1000 people. • What does a CBR of 50 mean?
Crude Death Rate: CDR • Number of deaths in a year for every 1000 people alive
Natural Increase Rate: NIR • Percent by which a population grows in a year • Subtract CDR from CBR after converting the numbers to percentages • CDR 5 per 1000 • CBR 20 per 1000
Natural Increase Rate: • NATURAL increase rate: How the population naturally increases. • Does this include migration to and from the country?
Doubling Time • Rate of natural increase affects the doubling time: number of years needed to double a population (constant rate of natural increase) • Rate of 1.2: in 2100 the population would be 24 billion
Population Decline: • What countries/regions? • NIR declining in Europe
Differences in Growth Rates: • Fertility rates • Mortality rates • We use both to explain how countries and regions vary in population growth (or even population decline)
Fertility • Crude Birth Rates: total number of live births a year per 1000 people. • CBRs mirror Natural increase rates (NIRs) on maps
Mortality • Infant Mortality Rate (IMR) • Annual number of deaths of infants under 1 per 1000 live births • Life Expectancy
Mortality: • Life expectancy: • Average number of years a newborn infant can expect to live • High life expectancy where?
What is overpopulation? Number of people exceeds the environment’s ability to support life
Help? • Economic growth must be faster than population growth • --> impoverishment
Government Policies: Cont’d • Restrictive Population Policies • China: 1-child policy (housing privileges, financial opportunities, education) • Abortion, female infanticide, orphan girls • India
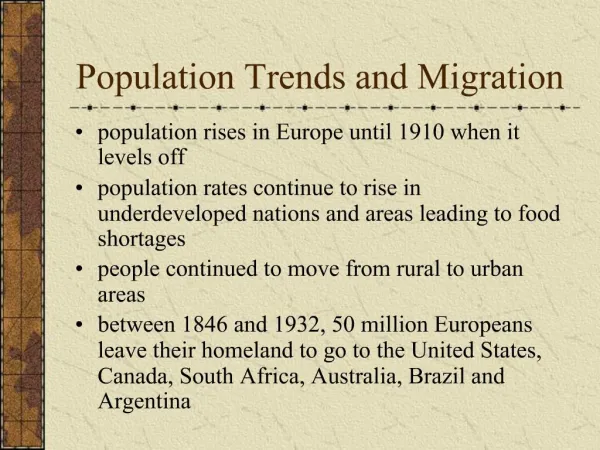
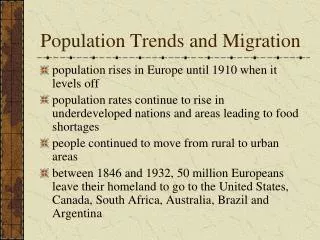
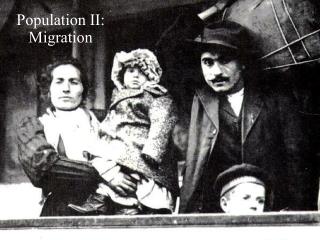
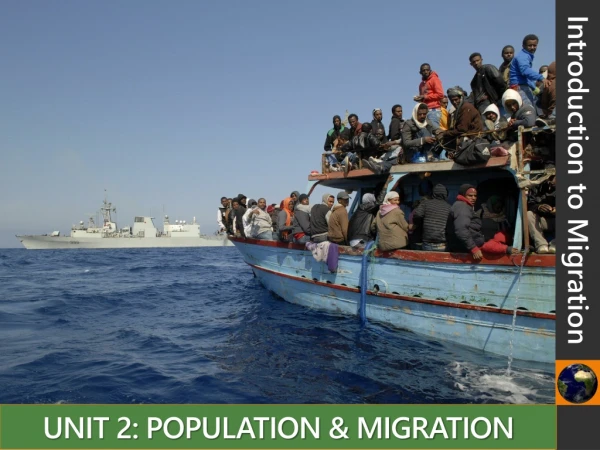
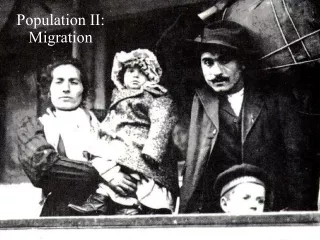
Migration Permanent move to a new location