Unit 2 Population
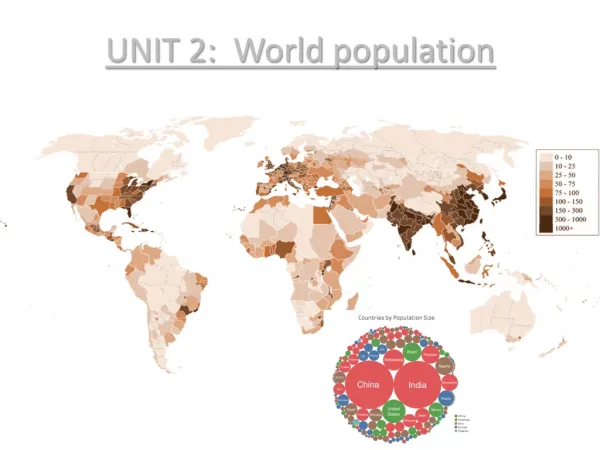
Unit 2 Population. Objective : Students will examine the causes and effects of population growth and overpopulation. Drill: The most populous country in the world is A ) China . B) India . C) Russia . D) Indonesia . E) Republic of Congo. . Where do People Live?.


Unit 2 Population
E N D
Presentation Transcript
Objective: Students will examine the causes and effects of population growth and overpopulation. • Drill: The most populous country in the world is • A) China. • B) India. • C) Russia. • D) Indonesia. • E) Republic of Congo.
Arithmetic Density – the total number of people per a unit of land area. U.S. = 76/mi2; NYC=1,000,000/mi2; Australia = 7/mi2 Physiological Density – the total number of people per a unit of arable (farmable) land.
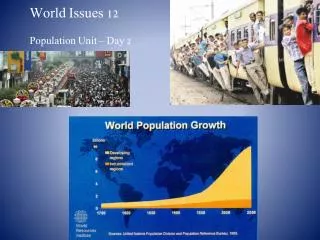
World and Country Population Totals Distribution and Structure: 3/4 of people live on 5% of earth's surface! Total: 6.8 billion on planet as of March 5, 2010 Current World Population Counter from U.S Census Bureau Five most populous regions and countries REGION POPULATION COUNTRY POPULATION • East Asia 1.6 billion China 1.3 billion • South Asia 1.5 billion India 1.1 billion • Europe 1 billion U.S. 300 million • SE Asia 600 million Indonesia 250 million • E N. America &Canada 275 million Brazil 188 million
Overpopulation • Is the world overpopulated?
Objective: Students will examine the demographic transition model and how it relates to population. • Drill:1) Geographers define overpopulation as • A) too many people in the world. • B) too many people compared to resources. • C) too many people in a region. • D) all of the above • E) A and C
Why is the Population increasing at different rates all over the world? Population Characteristics MDCs Population Characteristics LDCs
World Death Rates • Epidemiological Transition is the shift from infectious to degenerative diseases that occurs with development. • Infectious diseases (developing world) • HIV/AIDS • SARS • Malaria • Cholera • Degenerative diseases (developed countries) • Obesity • Tobacco use
Demographic Transition Model - was highly predictive for most countries
Demographic Transition Model • Stage one (preindustrial/pre-agricultural) • Crude birth/death rate high • Fragile, but stable, population • Pre-agricultural/industrial revolution • Most of human history was spent in stage 1; no countries exist there today.
Demographic Transition Model • Stage two (improved agriculture and medicine) • Lower death rates • Infant mortality rate falls • Natural increase very high • Industrial Revolution • 1800: Europe, North America • 1950: Many countries in Africa, Asia, Latin America
Demographic Transition • Stage three (attitudes change) • Indicative of richer developed countries • Higher standards of living/education • Crude birth rate finally falls • 1950s: Europe, North America • Recently Asia, Latin America
Demographic Transition Model • Stage four • Crude birth/death rates low • Population stable • Populations aging • USA, Sweden, Japan, Britain
Problems with the Demographic Transition Model • based on European experience, assumes all countries will progress to complete industrialization • many countries reducing growth rate dramatically without increase in wealth – TV and family planning seem to be at work • on the other hand, some countries “stuck” in stage 2 or stage 3, particularly in Sub-Saharan Africa and Middle East
TED VideoAs you watch the video fill in the chart with the various characteristics of each
TED Video Follow-Up • According to Hans Rosling, how can ALL nations move away from the “Shoes” stage and become more “developed?” • In your opinion, is it possible? Why or why not?
Objective: Students will analyze population pyramids and how they relate to the demographic transition model. • Drill: For every 1,000 babies born in Mozambique this year, nearly 150 of them will die before they reach their first birthday. The rate of 150 deaths per 1,000 births is known as the • A) crude death rate. • B) infant mortality rate. • C) life expectancy. • D) total fertility rate. • E) terminal population rate.
Population Pyramids • Population Pyramids quickly show • age distributions • demographic booms and busts • sex ratios • dependency ratios • Wide base depicts young population; narrow base suggests declining birth rates or growing elderly population.
Dependency Ratios • Number of people who are too young or too old to work compared to the number of people in their productive years. • 3 groups: 0-14, 15-64, and 65 or older
Dependency Ratios • As countries move from stage 1 to stage 4 of Demographic Transition Model, # of elderly increases. • Effects?
Sex Ratio • # of males per 100 females. • Europe and North America 95:100 • World is 102:100 • Lower female populations in LDC. Why?
Objective: Students will examine various theories of, and solutions to overpopulation around the world. • Drill: Which of the following is the least significant factor affecting population growth rates? A. Doubling times B. Sex ratio C. Total fertility rate D. Crude death rate E. Crude birth rate
Malthus, responding to Condorcet, predicted population would outrun food supply, leading to a decrease in food per person. Assumptions Populations grow exponentially. Food supply grows arithmetically. Food shortages and chaos inevitable. Thomas Malthus on Population An Essay on the Principle of Population, 1798
Neo-Malthusians • 1. Many LDCs (stage 2) have better medicine and better food production. The result is more poor people. • 2. Wars and civil violence will increase because of scarce food, clean air, arable (farmable) land, oil, etc.
Exit Ticket • On a separate sheet of paper, answer the following questions: Be sure to use specific examples in your answers. • 1. In your opinion, should the government be able to use legislation (laws) to control the population? Why or why not? • 2. In your opinion, what is the most effective way to control the population? Why?