Download

1 / 7
70 likes | 95 Vues
Explore components shaping global population growth, including birth and death rates, fertility trends, mortality indicators, and population structure variations within countries. Learn about natural increase rates, dependency ratios, and sex ratios in different regions.

E N D
Components of Population Growth • Geographers measure population change by using three measures: • Crude Birth Rate (CBR) – total number of live births in a year for every 1,000 people alive in society. • Crude Death Rate (CDR) – total number of deaths in a year for every 1,000 people alive in society. • Natural Increase Rate (NIR) – percentage by which a population grows in a year. • Computation: CBR – CDR = NIR • Remember NIR is a percentage ( n per 100, while CBR and CDR are expressed as n per 1,000) • First convert to 100 from 1,000 then subtract
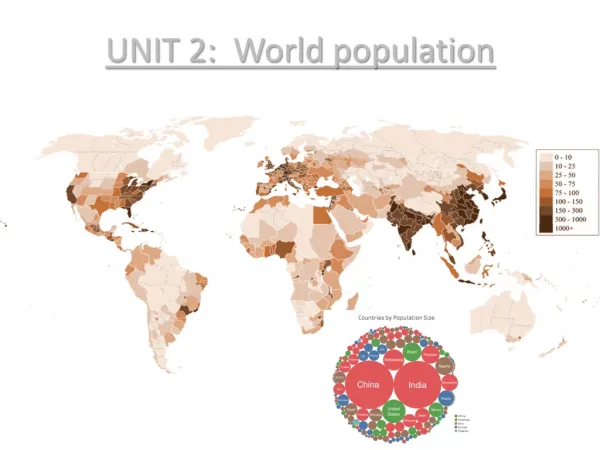
Components of Population Growth • Natural Increase • About 82 million people are added each year • Rate of natural increase affects the doubling time • Number of years needed to double the population • 70 divided by rate of natural increase or overall growth rate gives you doubling time • Twenty-First Century growth rate: 1.2% • 70/1.2 = 58 years doubling time • Over 95 percent of the natural increase is clustered in developing countries
Components of Population Growth • Fertility • Total Fertility Rate (TFR) • Measure used to measure number of births in a society • Average number of children a woman will have throughout her childbearing years (15–49) • TFR for world is 2.5, 5 in sub-Saharan Africa, Niger is 6.85 • 98 countries are below the replacement rate of 2 children • 2 or less in nearly all European countries • Japan is 1.4, Singapore is .8, USA is 2.0 • Mortality • Infant Mortality Rate (IMR) • The annual number of deaths of infants under one year of age, compared with total live births • Expressed per 1,000 births • IMR is 5 in developed countries and 80 in sub-Saharan Africa
Population Structure • Fertility and mortality vary within a country • A population pyramid can visually display a country’s distinctive population structure • X-axis • Percent male displayed to the left of zero • Percent female displayed to the right of zero • Y-axis • Age cohorts typically grouped in 5-year intervals • Youngest displayed at bottom and oldest at top
Population Structure • Dependency Ratio • Number of people who are too young or too old to work, compared to the number of people in their productive years. • People aged 0 to 14 and over 65 years old are considered dependents. • Larger dependency ratios imply greater financial burden on the working class. • 85 percent in sub-Saharan Africa, while 47 percent in Europe. • Sex Ratio • Defined as the number of males per 100 females in the population • Developed countries have more females than males, because they tend to live 7 years longer.