Download
1 / 50
500 likes | 586 Vues
Explore cutting-edge methods to combat infectious diseases with microchip technology. Key topics include pathogenomics, virulence factors, and boosting the innate immune system. Uncover insights from the Pseudomonas Genome Database and Microarray analysis software development.

E N D
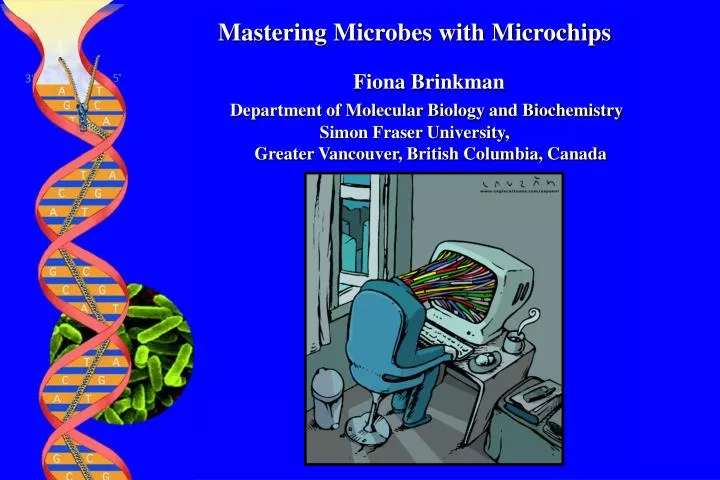
Mastering Microbes with Microchips • Fiona Brinkman • Department of Molecular Biology and Biochemistry • Simon Fraser University, Greater Vancouver, British Columbia, Canada
What I won’t talk about! • Pseudomonas Genome Database: Model for continually-updated genome annotation and analysis • Microarray analysis software development for the Pathogenomics (FPMI) Project
How can we best combat infectious disease causing-bacteria?
Rank Name Kills 1. Fiona 54 2. Ryan 0 = +
= +
Pathogens and The Art of War • “What is of supreme importance in war is to attack the enemy's strategy. Next best is to disrupt his alliances by diplomacy. The next best is to attack his army. And the worst policy is to attack cities.”
Pathogens and The Art of War • “And the worst policy is to attack cities.”
Prevalence of Superbugs 40 30 MRSA VRE % of Isolates 20 10 0 1980 1982 1984 1986 1988 1990 1992 1994 Source: Clinical Infectious Diseases 24:S133 (1997) Infectious Diseases – There must be a better way… • Leading cause of productivity loss • Responsible for two thirds of deaths of persons under age 40
Pathogens and The Art of War • “What is of supreme importance in war is to attack the enemy's strategy.” • strategy = virulence factors
Pathogens and The Art of War “Attack your enemy where he is unprepared” Boost innate immune system
How can we best combat pathogens? • A. Identify pathogen proteins more likely to be… • …virulence factors • - VGS Database and IslandPath • …quickly accessible to drugs/immune system (cell surface) • - PSORT-B • B. Identify human genes involved in boosting our innate immune system • Summary of insights and lessons learned…
Virulence Gene Subset (VGS) Database • Based on literature analysis • Experimentally determined virulence factors • Extensive information in separate fields • Species information • Gene/Protein information • Gene knockout information relevant to virulence studies • Infection assay information • References
Horizontal Gene Transfer and Virulence Factors Pathogenicity Islands: Uro/Entero-pathogenic E. coli Salmonella typhimurium Yersinia spp. Helicobacter pylori Vibrio cholerae Transposons: ST enterotoxin genes in E. coli Prophages: Shiga-like toxins in EHEC Diptheria toxin gene, Cholera toxin Botulinum toxins Plasmids: Shigella, Salmonella, Yersinia
Pathogenicity Islands Associated with • Atypical %G+C • tRNA sequences • Transposases, Integrases and other mobility genes • Flanking repeats
IslandPath: Aiding identification of Pathogenicity Islands and other Genomic Islands Yellow circle = high %G+C Pink circle = low %G+C Region of unusual dinucleotide bias tRNA gene lies between the two dots rRNA gene lies between the two dots Both tRNA and rRNA lie between the two dots Dot is named a transposase Dot is named an integrase _ Hsiao et al. (2003) Bioinformatics 19: 418-420
Dinucleotide bias analysis Genome divided into “ORF-clusters” of 6 consecutive ORFs Dinucleotide relative abundance is calculated for the region as*XY = f*XY/f*Xf*Y where f*X denotes the frequency of the mononucleotide X f*XY the frequency of the dinucleotide XY For each ORF cluster, the average absolute dinucleotide relative abundance difference is where f (fragment) is derived from sequences in an ORF-cluster g (genome) is derived from all predicted ORFs in the genome Hsiao et al. (2003) Bioinformatics 19: 418-420
Dinucleotide bias analysis “ORF-clusters” sampled in an overlapping manner (shift by one ORF at a time) The mean is calculated by averaging the results from all ORF-clusters in the genome Regions with greater than 1 standard deviation away from the mean are marked on the IslandPath graphical display with strikethrough lines Why did we use 6 ORFs per cluster? - Not enough bp in a single ORF to get a good estimate - 4.5kb (corresponding to approximately 6-8 ORFs) is required for “reliable estimation of nucleotide composition”(Lawrence and Ochman, J Mol Evolution 1997 44:383-97)
Boxes: Known islands in the Salmonella typhi genome 1 VI 7 V 11 II IX 20 I VIII 22 III IV 32 VII 33 X 36 34 35
What features best predict Islands? Examined prevalence of features in over 200 known islands • 94% of islands contain >25% dinucleotide bias (majority have >75% dinucleotide bias coverage) • Mobility genes identified in >75% (but ID recently improved) • Atypical %G+C (above cutoff used in Brinkman et al., 2002) not over 50% coverage on average, and tRNA genes not observed with >50% of known islands
1 VI 3 7 V 11 II 18 IX 20 I VIII 22 III IV 32 VII 33 X 36 34 35 1 5 6 9 10 12 14 15 13 17 21 22 24 32 33 34 36 35 Boxes: “Insertions” in the Salmonella typhi genome verses Salmonella typhimurium
Properties of genes in these islands? Defined a “putative island” as • 8 or more genes in a row with dinucleotide bias Functional category analysis Any difference for genes in islands verses genome?
P value of Paired T test (66 organisms): 4e-19 Hypothetical genes are more common in putative islands vs the rest of the genome
Why are hypothetical genes more common within putative islands/dinucleotide biased regions? • Genes being horizontally acquired in bacteria come from a large pool of as yet unstudied genes? • Genes are being miss-predicted within these regions because of the region’s different genomic composition? • Testing hypothesis 2: - Genes <300 bp in size are more likely to be false positives - Therefore, remove genes less than 300 bp and reanalyze
P value of Paired T test (55 organisms): 0.027
P value of Paired T test (66 organisms): 3e-17
Aquiring genes = Acquiring subnetworks bacterial cell Most functional categories involve cytoplasmic proteins Secretion category more associated with subcellular localization and possible subnetworks that would easy to add to an existing cell network
What does all this mean? • Acquired genes may come from a large pool of genes of which many are still uncharacterized? • Acquired genes = acquired subnetworks …that involve interactions that cross cell membranes? • What predicted gene dataset you use can have a significant effect on downstream analyses. • Analyzing correlations is difficult! Keep testing those hypotheses!
Future studies • Vary the analysis approach - Same result with other functional category classification systems - More precise criteria for identifying islands- Different dinucleotide bias calculation? • Examine in the context of gene expression data • Statistical modeling of the data (Dana Aeschliman and Jenny Bryan)
How can we best combat pathogens? • A. Identify pathogen proteins more likely to be… • …virulence factors • - VGS Database and IslandPath • …quickly accessible to drugs/immune system (cell surface) • - PSORT-B • B. Identify human genes involved in boosting our innate immune system • Summary of insights and lessons learned…
Subcellular Localization Prediction Annotation Experimental design Functions Drug/vaccine targets
www.psort.org/psortb • Web-based subcellular localization prediction tool • Score for each of 5 primary Gram -ve localization sites • PSORT I does not predict extracellular proteins • Also returns “unknown” (PSORT I forces a prediction) • Trained and tested using a dataset of proteins of experimentally-verified subcellular localization • Constructed manually through literature review • Largest dataset of its kind • Analyzes 6 biological features using 6 modules • More comprehensive than existing tools
PSORT-B Modules Signal peptides: Non-cytoplasmic Amino acid composition/patterns: Cytoplasmic All localizations - Support Vector Machine’s trained with aa composition subsequences Transmembrane helices: Inner membrane - HMMTOP PROSITE motifs: All localizations Outer membrane motifs: Outer membrane - Association-rule mining to identify Homology to proteins of experimentally known localization: All localizations - “SCL-BLAST” against database of pro of known localizations - E=10e-10 and Length restriction of 80-120% vs both subject and query Integration with a Baysian Network
Of Precision, Recall and Accuracy… TP TP+FP • PSORT- B designed for high precision (97% specificity, ) • PSORT I’s specificity measured at 59% • However, recall lower (75% sensitivity, ) which affects overall measure of accuracy • PSORT I recall 60% • New version to be released this year TP TP+FN
Insights Gained During Development • Localization is an highly evolutionarily conserved trait • Conserved between Gram-positives and Gram-negatives (for localizations present in both classes) • Reflection of the: Need for cell to conserve subcellular networks? Different environments of each localization?
Insights Gained During Development • Identified motifs characteristic of outer membrane proteins through a data mining approach (Martin Ester, Ke Wang, and others) • Motifs (~6 aa long) map primarily to periplasmic turn regions of known 3D structures • May reflect importance of periplasmic turns in a transmembrane beta-barrel structure vs. other similar non-membrane barrel structures Periplasmic turns
Analysis of bacterial proteomes • What proportion of proteins are of a particular subcellular localization? • Investigating the hypothesis: • The proportion of membrane proteins increases in those organisms inhabiting a greater variety of environments • Analysis of the deduced proteomes from 77 bacterial genome projects.
What does this mean? • Protein localization is very conserved • Increased genome size = increase in networksTherefore, conservation in localization proportions indicates that new networks being added tend to traverse localizations • Note: Can’t discount biases in unpredicted proteins, but new PSORT-B version will help confirm results
Summary • Converting pathogens and boosting rapid defenses may be the way to win the war against pathogens • Identifying virulence factors is critical • Acquired genes, including virulence factors, may come from a large pool of genes that are predominantly uncharacterized. • Acquired genes = acquired subnetworks that involve interactions that tend to traverse subcellular boundaries.
The Brinkman Lab Dana Aeschliman Jenny Bryan Martin Ester Ke Wang Rong She Christopher Walsh Genome Prairie Genome BC Inimex NSERC RayKarsten Geoff Sébastien Matt Jenn Will MikeFiona Anastasia “The other Alison Fiona” All Software freely available and open source www.pathogenomics.sfu.ca/brinkman
Functional Pathogenomics of Mucosal Immunity www.pathogenomics.ca INDUSTRY Inimex Pharma Inc ACADEMIA VIDO, U Sask UBC, SFU, BCGSC FPMI GOVERNMENT Genome Canada Genome Prairie Genome BC Govt of Saskatchewan