Download
1 / 1
10 likes | 140 Vues
Local Source Deposition ( 2x10 9 g/yr). 1x10 9 g/yr. Current atmospheric Hg is 3x pre-modern atmospheric Hg (4.). Fig. 1. Pre-Modern mercury cycle. Fig 5. Linear regression of Pb-210 concentrations. Slope is used to determine sediment interval age.

E N D
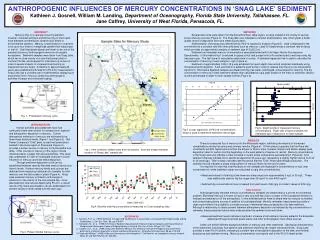
Local Source Deposition (2x10⁹ g/yr) 1x10⁹ g/yr Current atmospheric Hg is 3x pre-modern atmospheric Hg (4.) Fig. 1.Pre-Modernmercury cycle. Fig 5. Linear regression of Pb-210 concentrations. Slope is used to determine sediment interval age. Fig 6. Depth profile of measured mercury concentrations. Right side of figure indicates the estimated age of deposition for each sample. Fig 3. Rain collection sample sites and Hg sources. Blue star shape indicates location of “Snag Lake” sample site. Fig 2. Present Global mercury cycle. ANTHROPOGENIC INFLUENCES OF MERCURY CONCENTRATIONS IN ‘SNAG LAKE’ SEDIMENT Kathleen J. Gosnell, William M. Landing, Department of Oceanography, Florida State University, Tallahassee, FL. Jane Caffrey, University of West Florida, Pensacola, FL. ABSTRACT Mercury (Hg) is a naturally occurring element, however, industrial activities and the burning of fossil fuels have elevated concentrations towards toxic levels in environmental systems. Mercury concentrations in coal tend to be up to four orders of magnitude greater than natural gas or fuel oil. Coal-fired power plants are known to be one of the greatest sources of anthropogenic mercury into aquatic ecosystems. Sediment samples were taken from Snag Lake, which lies in close vicinity of a coal-fired power plant in northern Florida, and analyzed for total mercury content in order to assess impacts of increased coal burning on measured mercury levels. A timeline of approximately 60 years was established with lead 210 (Pb-210) measurements. Snag Lake has a constant rate of sedimentation displaying an exponential rise in mercury content as anthropogenic activities increase environmental loading. METHODS Several lake cores were taken from the Escambia River delta region, an area located in the vicinity of several known mercury sources (Figure 3). The Snag lake core indicated a constant sedimentation rate, which yields a better quality record of deposition and trace metal accumulation. Sedimentation chronology was determined by Pb-210 regression analysis (Figure 5). Lead is deposited in the environment at a constant rate with other pollutants such as mercury. Lead 210 experiences a constant rate of decay which provides an approximate analysis of sediment age (t1/2=22.3 yr). Sediment and rainwater mercury concentrations were determined with Cold Vapor Atomic Fluorescence Spectrometry. In this method Hg2+ is reduced to gaseous Hg0 and purged onto a Au-coated quartz sand trap using Hg-free argon gas. The Hg0 signal is recorded as peak area in counts. A standard regression line is used to calculate the concentration of mercury in each sample in ng/L (Figure 4). Sediment of approximately 0.05-0.15 g was extracted from each depth interval and analyzed individually using microwave bomb digestion. A set acid matrix is added to each bomb in order to release total mercury into measurable liquid form. Microwave digested samples are diluted with Hg-free water, centrifuged, and analyzed for total-Hg. The dry concentration of mercury in each sediment sample than calculated as ng/g (ppb) based on the mass of sediment, dilution, and the percentage of water in each sample interval (Figure 6). Molino Pace 1x10⁹ g/yr Ellyson INTRODUCTION Human activities associated with fossil fuel combustion have been shown to increase local, regional and atmospheric deposition of mercury. Current atmospheric emissions of mercury are estimated to be three times historical levels (Figure 1 and Figure 2). Gulf Power Company’s “Crist” plant, a coal-fired power plant located in the study region of Pensacola (Figure 3.), provides a known source of mercury to the Escambia river delta. Other sources of mercury in the region include chemical plants, a paper mill and automobiles. This study was undertaken in order to investigate local point source influence on mercury and trace metal deposition. Through sediment deposition a link can be established between recently elevated mercury levels and historic levels. Modern mercury levels and sources are deduced from measuring individual rain samples for total mercury over the last couple of years (Figure 4). Snag Lake sediment mercury is linked to anthropogenic emissions in the vicinity of the core sample site. Once lake sediment intervals are dated using Pb-210, a robust record of Hg mass accumulation can be established from present values to levels dated over 60 years ago. • RESULTS • There is a seasonal flux of mercury into the Pensacola region, exhibiting the majority of increased concentrations during the spring and summer months (Figure 4). At first glance it appears that the Pace site consistently exhibits higher amounts than the Ellyson or Molino sites, however, Ellyson and Molino display peak deposition rates for certain months depending on the wind patterns influence on rainfall. Mercury concentrations in the Snag Lake core indicate a clear increase in recent levels compared to past deposition (Figure 6). Core sediment intervals indicate minor elemental deposition 60 years ago, followed by a slightly higher interval from 40 to 10 years ago. This increase coincides with the period that the “Crist” Power plant began production. The sediment record indicates a sharp enhancement in mercury levels for the last 10 years. • It is important to note that total-Hg levels in rain samples are displayed in concentrations of ng/L (wet concentrations), while sediment values are calculated in ng/g (dry concentrations). • Measured values for total-Hg at the three rain sites range from approximately 3 ng/L to 35 ng/L. These sites additionally yield an Hg-flux range from 36 ng/m2 to over 4000 ng/m2. • Sediment Hg concentrations have increased from past levels of 69 ng/g to modern values of 439 ng/g. • DISCUSSION • Anthropogenically elevated mercury concentrations released into watersheds is a proven environmental problem. Elemental mercury is known to have a very long half-life of up to 2 years in the troposphere before it is oxidized and washed out of the atmosphere. In this extended period there is ample time for mercury to mobilize and contaminate pristine sources in addition to local watersheds. Monthly rainwater measurements provide a clear record where it is possible to correlate sources of elemental mercury deposition into lake sediment. Although a relationship is clearly present between atmospheric deposition as indicated by Hg concentrations in rainwater, these presented values were analyzed after the sediment core was taken. • Measured sediment levels indicate a significant increase of atmospheric mercury added to the Escambia watershed through coal-fired power plants and other anthropogenic trace metal sources. • Lakes can exhibit different background levels of mercury and other sediments. Geological characteristics of the watershed, hydrologic flow patterns and sediment reworking can impact measured levels. Snag Lake provided a clear Pb-210 profile, indicating a constant rate of atmospheric deposition to the lake, and minimal disturbance and sediment mixing. Mercury concentrations correspond well to the Pb-210 depth profile. • . / Fig 4. Monthly total-Hg concentrations measured for 3 rain sampling sites. REFERENCES 1. Santschi, P. et. al,. (1999) Sediment Transport and Hg Recovery in Lavaca Bay, as Evaluated from Radionuclide and Hg Distributions. J. Env. Sci. Tech., 33., pp. 378-391 2. Kahkonen, M., et. al,. (1998) 100 Years of Sediment Accumulation History of Organic Halogens and Heavy Metals in Recipient and Nonrecipient Lakes of Pulping Industry in Finland. Env. Sci. & Tech., 32, pp 1741-1746. 3. Landers, D.H., et. al,. (1998) Using Lake Sediment Mercury Flux Ratios to Evaluate the Regional and Continental dimensions of Mercury Deposition in Arctic and Boreal Ecosystems. Atmospheric Environment, 32, pp. 919-928. 4. Fitzgerald, William F. (1995) Is Mercury Increasing in the Atmosphere? The Need for an atmospheric mercury network. Water Air and Soil Pollution, 80: 245-254.