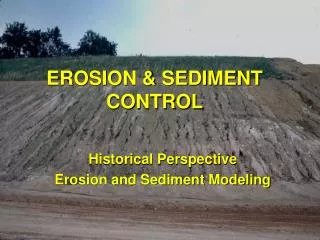
EROSION & SEDIMENT CONTROL
EROSION & SEDIMENT CONTROL. Historical Perspective Erosion and Sediment Modeling. GEOLOGIC EROSION vs ACCELERATED EROSION. EARLY WORK. What is SCS?. Soil Erosion Service Soil Conservation Service Natural Resource Conservation Service. The Universal Soil Loss Equation A=RKLSCP.

EROSION & SEDIMENT CONTROL
E N D
Presentation Transcript
EROSION & SEDIMENT CONTROL Historical Perspective Erosion and Sediment Modeling
What is SCS? • Soil Erosion Service • Soil Conservation Service • Natural Resource Conservation Service
The Universal Soil Loss EquationA=RKLSCP • Massive data base assembled (1950s – 1970) • Standard plots established throughout the US • 72.6 ft long • 13.3 ft wide • 9% slope • Fallow for two years • Up and downhill tillage (Wischmeier and Smith, 1965 and 1978)
PREDICTING EROSION USLE/RUSLE A statistically-based model A = R K LS C P Some things we can control Some things we cannot control
Rainfall Energy R-factor We cannot control R factor • Mobile, AL R = 650 • Oklahoma R = 80 – 300 • OKC R = 200
Soil Erodibility K-factor • We have little control of K factor • Silt loam soil: K = .32 • Loamy fine sand: K = .17 Affected by soil amendments
Length-Slope LS-factor • We have limited control on LS factor • 9% slope, 72.6 ft: LS = 1.0 • 10 % slope, 200 ft: LS = 2.41 • 15 % slope, 200 ft: LS = 4.3 • 20% slope, 200 ft: LS = 11.31 Terraces, diversions, grade control
Cover Factor - C 0.5 tons/ac straw C=0.3 2.0 tons/ac straw C=0.09 4.0 tons/ac woodchips C=0.42 We can have a big impact on C-factor
Cover Factor Geotextiles C = ???
Cover Management • Location of cover relative to receiving stream is important
EXAMPLE 1 } => LS = 1.0 Typical R = 200 Darnell K = 0.32 Slope Length = 300 ft Slope = 5% Mature Forest C = 0.001 Practice Factor P = 1 A = 0.064tons/ac-yr
EXAMPLE 2 } => LS = 1.0 Typical R = 200 Darnell K = 0.32 Slope Length = 300 ft Slope = 5% Bare Soil (bulldozed) C = 1 Practice Factor P = 1 A = 64tons/ac-yr
Ratio of Sediment ProductionChanged Land Use/Undisturbed Forest
USLE EROSION vs. SEDIMENT YIELD GULLY CHANNEL
USLE GULLY CHANNEL Event-based erosion estimationModified USLE(MUSLE) • Q = Storm runoff • qp = Peak discharge • KLSCP = USLE parameters WILLIAMS (1975)
Statistically Based Erosion Models • Not process based • Strong interactions between parameters, particularly with steep slopes characteristic of many urban sites • Requires a lot of data to project from one situation to another without massive data base
RECENT WORK • Extensive use of rainfall simulators and instrumented plots • Process based models • Incorporation into watershed models of hydrology and sedimentology • Include the impact of BMPs and channel erosion
RAINFALL SIMULATORS • Earliest version of rainfall simulator • Simulation became a powerful tool in erosion research
Large Plot Simulator Single Nozzle Simulator • Rotating boom simulator MODERN SIMULATORS
Automatic runoff measurement and sampling Innovative runoff measurement and sampling Microrelief measurement MODERN EROSION PLOTS
Characteristics of Recent Models 1990s • Process based • Divided into rill and inter-rill erosion • Consider concentrated flow erosion separate from rill and inter-rill • Deposition and detachment based on transport capacity and detachment potential.
Rill & Interrill Erosion • Rill erosion due to shearing forces of runoff • Interrill erosion due to rainfall impact
RILL EROSION POTENTIAL:WEPP Model Drc = Rill detachment potential Kr = Rill erodibility • = Channel shear = gRS tc = Critical tractive force Fa = Correction factor for soil type, cover, and freeze thaw
ACTUAL RILL EROSION:WEPP Model Drc = Rill detachment potential Dr = Actual detachment qs = Sediment load Tc = Transport capacity
Parking Lot Topsoil Stockpile Drainage Channel Sediment Transport Capacity Sediment Load Distance Down Channel
Rills: Location controlled by tillage microrelief Ephemeral Gullies TYPES OF EROSION: Concentrated Flow or Ephemeral Gully • Location is due to macrorelief • Shearing forces of runoff causes erosion
We We NEL NEL NEL NEL Wf Concentrated Flow Erosion: Foster-Lane Model
We NEL NEL DNEL Wf Concentrated Flow Erosion: Foster-Lane ModelAssumes Constant Flow Rate Included in CREAMS and WEPP Models
Concentrated Flow Erosion: KY DYRT Model • Allows varying flow rates • Allows layers of varying density • Allows deposition • Included in SEDIMOT III
SEDIMENT SIZE DISTRIBUTION • Eroded size distribution needed to predict transport and BMP effectiveness • Methods available: • CREAMS based model • Empirical study
OTHER WATERSHED MODELSWith Erosion Components • CREAMS • SEDIMOT II • SEDCAD • SEDIMOT III • AGNPS • SWAT