Download
1 / 34
350 likes | 565 Vues
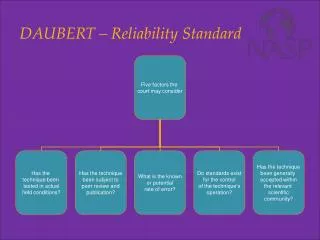
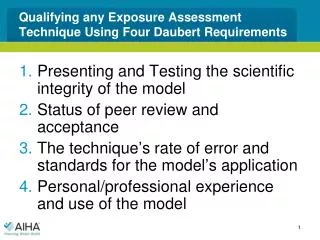
Qualifying any Exposure Assessment Technique Using Four Daubert Requirements. Presenting and Testing the scientific integrity of the model Status of peer review and acceptance The technique’s rate of error and standards for the model’s application

E N D
Qualifying any Exposure Assessment Technique Using Four Daubert Requirements • Presenting and Testing the scientific integrity of the model • Status of peer review and acceptance • The technique’s rate of error and standards for the model’s application • Personal/professional experience and use of the model
Scientific Basis of the Near Field/Far Field (NF/FF) Model The NF/FF Model is a derivation of the simpler well-mixed (WMB) box model:
The WMB Model is Based on First Principles. What does that mean? • Basic, foundational propositions or assumptions that cannot be deduced from any other proposition or assumption • Principles from which other truths can be derived • A core set of working assumptions, hypotheses, and key beliefs.
The fundamental propositions of the WMB Model are simple: • Mass entering and leaving the box cannot be created or destroyed. • The air entering the box (Q) equals the air leaving the box (Q) in any reasonable time frame. • The source rate of mass entering the box (G) is either constant over the time frame of interest for constant rate sources or a predictable function of time. • Mass within the box is all airborne—that is, there is no adsorption or deposition of the substance on the interior surfaces of the box.
These are typically valid assumptions on their face; however … • Chemicals of interest entering the box at Rate G may not come in at an absolutely constant or predictable time-dependent rate • They might undergo reactions and transformations to another chemical form while in the box or, • there could be some sorption of the material to the surfaces within the box
These deviations from ideality notwithstanding, our experience with this model is that it has provided valuable information, typically reasonable estimates of the average concentration of an emitting contaminant into the indoor air volume under consideration
Deviations from stated model conditions occur in all physical-chemical models • It the “nature of the beast” • All physical chemical models are more or less generalized portrayals of reality and are not perfect renditions of the real world • Prime examples are the metrological models used to predict weather – clearly they are simply describing the atmospheric forces in real time a some more or less rough level of detail.
Thus all model-predictions are UNCERTAIN • We know that metrological models are accompanied with an acknowledged percentage (e.g., % chance of rain) related to their prediction. • Our manner of describing uncertainty in physical chemical models of exposure are with ranges or error bands.
Uncertainty is NOT Limited to Models • Previous work indicates that the uncertainty associated with AIR MONITORING whenrelatively few samples are taken (the typical situation) – can be as or more uncertain than modeling • Ref: Nicas, M and M. Jayjock, Uncertainty in Exposure Estimates Made by Modeling Versus Monitoring, AIHA Journal 63:275–283 (2002)
This brings us to a defining statement and truth about MODELS “Essentially, all models are wrong, but some are useful.” Ref: Box, G., and N. Draper: Empirical Model-Building and Response Surfaces. Hoboken, N.J.: John Wiley & Sons, Inc., 1987. We believe that Daubert goes to the practical usefulness of the model under consideration in predicting exposures with prospectively or retrospectively.
Thus, given the acceptance of the above set of assumptions, the WMB can, within reasonable limits, accurately predict the overall spatial averageconcentration of airborne contaminant in the well-mixed box at any point in time. The average concentration is simply the total amount of material in the box at any point in time divided by the volume of the box.
The Problem with the WMB Model • It assumes perfect mixing in the entire volume with is typically not true • Thus, the airborne concentration near an emitting source within a room is significantly greater than it is at more distant points within the same volume • Thus the WMB has an essentially “built-in” error that will underestimate the potential exposure to persons near the source of emission
This deficiency in the WMB Model lead to the development of the NF/FF Model • The NearField (NF)/FarField(FF) Model is also a first principle model. • It is an extension of the WMB model that essentially adds a smaller virtual box or volume within the general box or total room volume. • The assumption is again made that the air is well mixed within this smaller (NF) volume and the larger (FF) volume and that air exchanged between the two volumes is totally dependent on the linear airflow at the interface between the two volumes.
Good and Bad Points of the NF/FF Model • Good - Since the NF is now much smaller and close to the source, the average concentration in the NF is much more accurate and useful for estimating the exposure potential for a person breathing the air within the NF. • Bad – It is significantly more complicated mathematically than the WMB. It also requires greater input – specifically the rate of air exchange between the NF and the FF.
The “Bad” is actually not so bad • The air exchange rate between the NF and FF volumes is a relatively straightforward determination based on the rate of linear air flow within the volume of interest. • The math has been essentially tamed with the advent of a freeware spreadsheet available from the AIHA (IH MOD). Ref: AIHA: IH Mod. Freeware spreadsheet of mathematical models to estimate air concentrations of chemicals. Fairfax, Va.: AIHA, 2011.
The Size and Shape of the NF Volume • In general, the NF volume should be large enough to include both the breathing zone of the exposed person and the emitting source. • In the case of hair spray (or similar spray applications) it has been estimated to be less than 1 m3 in volume. • In recent work designed to estimate exposure from an evaporating spill in a laboratory or plant, it has been set at a volume of 25 m3– the volume of a 2 m diameter, 2 m high hemisphere. Refs: Sahmel, J., K. Unice, P. Scott, et al.: The use of multizone models to estimate an airborne chemical contaminant generation and decay profile: Occupational exposures of hairdressers to vinyl chloride in hairspray during the 1960s and 1970s. Risk Anal. 29(12):1699–1725 (2009). Jayjock, M.A., P.W. Logan, B. Mader, et al.: Modeled comparisons of health risks posed by fluorinated solvents in a workplace spill scenario. Ann. Occup. Hyg. 55(2):202–213 (2011).
Testing the NF/FF Model From a literature search, we located multiple studies where the NF/FF technique has been appropriately used and tested. The testing of the model actually involved 3 aspects: • Correctness of the mathematical derivation • Implementation of the computations and verification of the calculations • Testing of the model against suitable real world air concentration data
Correctness of the mathematical derivation The mathematical integrity of the NF/FF model has been verified by others in the peer review process of Dr. Nicas’ publications in journal articles and book chapters. Note an independent derivation of the principles was also completed and published by Furtawet al. Refs: Jayjock, M, T Armstrong, and M Taylor: The Daubert Standard as Applied to Exposure Assessment Modeling Using the Two-Zone (NF/FF) Model Estimation of Indoor Air Breathing Zone Concentration as an Example, Journal of Occupational and Environmental Hygiene, 8: D114–D122 Furtaw, E. Jr., M Pandian, D Nelson, et al.: Modeling indoor air concentrations near emission sources in imperfectly mixed rooms. J. Air Waste Manage. Assoc. 46(9):861 (1996).
Implementation of the computations and verification of the calculations The computational integrity of the equations and computations in MS Excel has been verified by independent setup MATLAB (or other symbolic mathematical program) and by others as a result of the publication in articles and book chapters Ref: Jayjock, M , T Armstrong, and M Taylor: The Daubert Standard as Applied to Exposure Assessment Modeling Using the Two-Zone (NF/FF) Model Estimation of Indoor Air Breathing Zone Concentration as an Example, Journal of Occupational and Environmental Hygiene, 8: D114–D122
Testing of the model against suitable real world air concentration data • Five independent studies provided 23 paired values of the predicted and measured near field concentrations, • 21 out of 23 (91%) predicted values were within a factor of 0.49- to 2.14-fold the measured concentration value. In other words, the NF/FF model prediction was usually within the approximate range of 0.5- to 2-fold the measured concentration. Ref: Jayjock, M , T Armstrong, and M Taylor: The Daubert Standard as Applied to Exposure Assessment Modeling Using the Two-Zone (NF/FF) Model Estimation of Indoor Air Breathing Zone Concentration as an Example, Journal of Occupational and Environmental Hygiene, 8: D114–D122
Another Critical Study Demonstrates the Overall Validity of the NF/FF Model • Stationary point and breathing zone monitoring conducted in a process control room with point sources of emissions • The stationary point monitoring data were input to a computer mapping procedure. The mapping program had the ability to interpolate concentration values in unsampled areas, thus creating contours of equal concentration levels within the horizontal plane of the room air Ref: Jones, B., and R. Harris: Calculation of time-weighted average concentrations: A computer mapping application. Am. Ind. Hyg. Assoc. J. 44(11):795–801 (1983).
Graphical Output of this Work • The program provided drawn lines of equal airborne concentration (i.e., isopleths) for the compound of interest (toluene) within the control room, and thus visually display the horizontal concentration pattern within the area of the room. • The investigators were able to resolve and organize five daily time-weighted average (TWA) concentration areas or bins within the room.
Agreement with NF/FF Model • Average concentrations between the lowest and highest zones vary by approximately 5-fold. • The most concentrated zone(s) appear(s) to be essentially circular in cross-section around the source(s); also the diameter of this zone is relatively small within the room varying between 6 and 12 feet (about 1.8 t0 3.6 meters). The is EXACTLY the pattern that is portrayed within and described by the NF/FF model.
A Separate Study Comparing NF/FF Modeled to Monitoring Data • used airborne monitoring data for hair spray propellant components that were collected in 1972 • the modeled results compared with the monitoring results were within a factor 1.8 • also, as noted by the authors, the monitoring techniques chosen for that study could have contributed to the differences between measured and modeled results. Ref: Hoffman, C.: Beauty salon air quality measurements. Cosmetic Toiletries Fragrances Assoc. Cosmet. J. 5:16–21 (1973).
The Technique’s Rate of Error, and Standards for the Model’s Application The quintessential question relative to Daubert for any model: “Does the chosen model, with its simplifying assumptions, adequately simulate conditions to give reasonable estimates and useful insights?” The above mentioned studies show that the rate of error is acceptable when used under it’s stated limits. That is, what are the “Standards for the Model’s Application” that assure it utility?
Standards for the Model’s Application The standards for the model’s application have been stated as the principle “bounding conditions” for the model’s legitimate use and can be summarized from the various publications and book chapters as follows: • The contaminant is instantaneously mixed throughout the near-field and far-field work space. That is, the air concentration is uniform within each of the two spaces. • There is limited airflow between the two zones. • The random air velocity between the two zones is uniformly distributed across the NF/FF interface surface. • There are no significant cross drafts.
Personal/professional experience and use of the model (1/3) • Among risk assessors, knowledge in modeling, the NF/FF model is currently considered to be the primary model of airborne concentration that we use when there is a concentrated source within room. • One of us (Jayjock) has used it extensively in consultations with both industrial and government clients, including the European Commission and U.S. Fortune 500 companies, and is the first author on a recent study of the exposure potential from spills of electronic chemical solvents within laboratory and plant settings Ref: Jayjock, M.A., P.W. Logan, B. Mader, et al.: Modeled comparisons of health risks posed by fluorinated solvents in a workplace spill scenario. Ann. Occup. Hyg. 55(2):202–213 (2011).
Personal/professional experience and use of the model (2/3) The NF/FF model has been used to predict airborne concentrations of Legionella, in a Legionnaires’ disease (LD) outbreak, as part of the development and evaluation of an LD quantitative microbial risk assessment model. Refs: Armstrong, T.W., and C.N. Haas: Legionnaires’ Disease: Evaluation of a quantitative microbial risk assessment model. J. Water Health 6(2):149–166 (2008). Armstrong, T.W., and C.N. Haas: A quantitative microbial risk assessment model for Legionnaires Disease: Assessment of human exposures for selected spa outbreaks. J. Occup. Environ. Hyg. 4:634–646 (2007). Armstrong, T.W., and C.N. Haas: A quantitative microbial risk assessment model for Legionnaires’ Disease: Animal model selection and dose-response modeling. Risk Anal. 27(6):1581–1596 (2007).
Personal/professional experience and use of the model (3/3) A collaborative international initiative led to the development of a “freeware” spreadsheet that includes the NF/FF model in the suite of models in an effort to simplify the computational burden of this important model for industrial hygienists. This effort is a general recognition of the value and utility of this important tool. It is also prominently featured in professional development courses (PDCs) and AIHA Publications Refs: AIHA: IH Mod. Freeware spreadsheet of mathematical models to estimate air concentrations of chemicals. Fairfax, Va.: AIHA, 2011 Keil, C.B. (ed.): Mathematical Models for Estimating Occupational Exposure to Chemicals. Fairfax, Va.: AIHA Press, 2000.
Summary/ConclusionsIn light of Daubert Criteria the NF/FF Model has: • Extensive Peer Reviewed Publications and Scientific Acceptance. • Provided Valid Test Results Against Suitable Measurement Data. • Satisfied Suitable Criteria for an Acceptable Rate of Error and Standards of Use. • The NF/FF Model Has Been Extensively Used in Professional Industrial Hygiene Practice and Exposure Assessment Studies.
![[Radiography] Technique - Exposure Factors](https://cdn0.slideserve.com/546181/radiography-technique-exposure-factors-dt.jpg)