Download
1 / 12
120 likes | 248 Vues
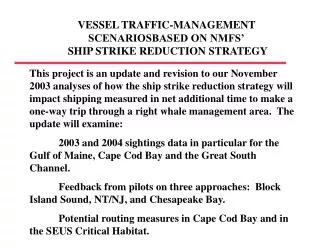
VESSEL TRAFFIC-MANAGEMENT SCENARIOSBASED ON NMFS’ SHIP STRIKE REDUCTION STRATEGY.

E N D
VESSEL TRAFFIC-MANAGEMENT SCENARIOSBASED ON NMFS’ SHIP STRIKE REDUCTION STRATEGY This project is an update and revision to our November 2003 analyses of how the ship strike reduction strategy will impact shipping measured in net additional time to make a one-way trip through a right whale management area. The update will examine: 2003 and 2004 sightings data in particular for the Gulf of Maine, Cape Cod Bay and the Great South Channel. Feedback from pilots on three approaches: Block Island Sound, NT/NJ, and Chesapeake Bay. Potential routing measures in Cape Cod Bay and in the SEUS Critical Habitat.
November 2003 report examined the impact on vessels to comply with proposed vessel operating restrictions calling at major ports. The analyses in the report were reviewed by Captain Larry palmer, Northeast Pilots and John Mauro, USCG Aids to Navigation Office Boston District (one). We received funding last year to update this report based on the NMFS strategy published in the June 2004 ANPRM, feedback and new information we received.basis for the proposed operating restrictions are in the report:
We conducted a series of five analysis: • 1. Application of Speed Restrictions • a) Accounting for vessels' need to take as much as one hour to slow from sea speed to maneuvering speed before entering a right whale management area. • b) Accounting for the requirement for vessels to take on a pilot when entering port: mid Atlantic ports and ports within the Southeast U.S. critical habitat. • 2. Retrospective Modeling of Dynamic Management Areas.
We conducted a series of five analysis: (continued) • 3. Review of Sighting Data in the Mid Atlantic. 4. Review of Vessel Traffic in Cape Cod Bay. • 5. Review of Sightings Data off Boston Approach Sea-lane off Race Point.
To accurately model how vessels would comply with vessel operating restrictions of a dynamic management or seasonal management area, additional time for entering and departing, as necessary, must be considered. This would likely be a factor in vessels choosing to route around an are versus reducing speed to transit an area.
Application of Speed Restrictions • Accounting for the requirement for vessels to take on a pilot when entering port: mid Atlantic ports and ports within the Southeast U.S. critical habitat.
Example from November 2003 analyses: to be updated Port of NY/NJ RS = 10 Knots RS = 12 Knots 20nm 25nm 30nm 20nm 25nm 30nm Vessel Category dry bulk--handy 25 28 33 16.7 15.3 16.4 handymax 25 28 33 16.7 15.3 16.4 Panamax 26 30 36 18.1 17.4 19.2 Cape 26 30 36 18.1 17.4 19.2 Tanker--product 25 28 33 16.7 15.3 16.4 Aframax 28 32 39 19.4 19.4 21.9 Suezmax 26 30 36 18.1 17.4 19.2 VLCC Container-1000TEU 28 32 39 19.4 19.4 21.9 --1500TEU 28 32 39 19.4 19.4 21.9 --2000TEU 35 53 68 26.2 40.7 50.7 --3000TEU 35 53 68 26.2 40.7 50.7 --4000TEU 35 53 68 26.2 40.7 50.7 LNG Car Carrier 30 35 44 21.7 22.9 26.7 Cruise ship 35 54 69 26.2 42.1 52.6 tug/barge--freight 19 18 20 0 0 0 ------tank 19 18 20 0 0 0
Retrospective Modeling of Dynamic Management Areas. The sightings data were queried using a GIS program, ARCVIEW, to determine when a Dynamic Management Area (DMA) could have been enacted based on trigger events: · a single sighting/detection of 3 or more animals; · two or more sightings/detection within one day totaling three or more animals with the sightings within 10 miles of each other; · a sighting/detection of a mother/calf pair within 15 nm of a shipping lane.
We examined the following areas: • Great South Channel • Approaches to Boston • Cape Cod Bay • Gulf of Maine • Approaches to Portland, ME • Block Island Sound
We originally examined sightings data for trigger events for the years 1998-2002. In addition we examined sightings data for trigger events in the Great South Channel for the years 1979-1981, 1987-1989, and 1991. We are updating this with data through the 2004 season. A 15 mile buffer was imposed around the outer periphery of the aggregation of sightings. Each DMA was enforce for a 13 day duration unless subsequent sightings dictated otherwise (suspend or extend).
Example form November 2003 analyses: Dynamic Management Areas (to be updated) Area/Port Boston Sea Lanes Duration,days Distance, nm Median 27 29 Mean 39 27 Minimum 13 30 Maximum 66 40