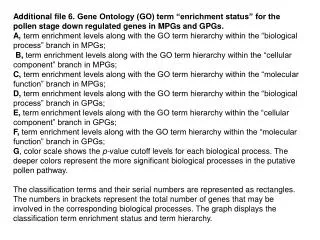
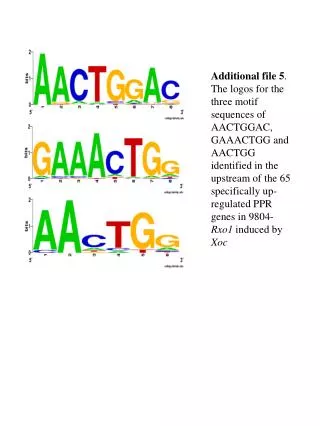
Download
1 / 1
10 likes | 109 Vues
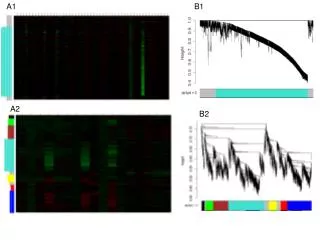
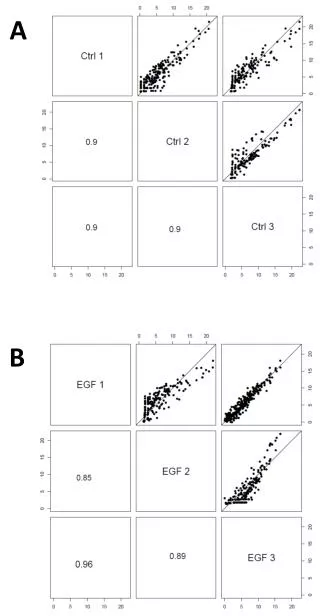
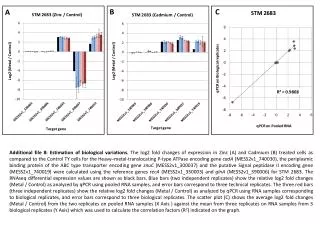
Log2 fold changes of zinc and cadmium treated cells compared to the control, calculated for genes cadA, znuC, and putative Signal peptidase II. Reference genes recA and glnA used; RNAseq values shown as black bars. Experimental data from qPCR analysis on pooled RNA samples and biological replicates displayed with error bars in blue and red bars, respectively. Scatter plot correlating replicates from RNA samples for correlation factor calculation.

E N D
Additional file 8: Estimation of biological variations. The log2 fold changes of expression in Zinc (A) and Cadmium (B) treated cells as compared to the Control TY cells for the Heavy–metal-translocating P-type ATPase encoding gene cadA(MESS2v1_740030), the periplasmic binding protein of the ABC type transporter encoding gene znuC (MESS2v1_300037) and the putative Signal peptidase II encoding gene (MESS2v1_740019) were calculated using the reference genes recA (MESS2v1_330003) and glnA (MESS2v1_390006) for STM 2683. The RNAseq differential expression values are shown as black bars. Blue bars (two independent replicates) show the relative log2 fold changes (Metal / Control) as analyzed by qPCR using pooled RNA samples, and error bars correspond to three technical replicates. The three red bars (three independent replicates) show the relative log2 fold changes (Metal / Control) as analyzed by qPCR using RNA samples corresponding to biological replicates, and error bars correspond to three biological replicates. The scatter plot (C) shows the average log2 fold changes (Metal / Control) from the two replicates on pooled RNA samples (X Axis ) against the mean from three replicates on RNA samples from 3 biological replicates (Y Axis) which was used to calculate the correlation factors (R2) indicated on the graph.