Download
1 / 42
420 likes | 440 Vues
This presentation provides a 10-year forecast for the remote sensing industry, including an overview of the industry baseline and results. It also discusses user needs and requirements, as well as the status and preliminary interview results. The presentation requests help from MAPPS.

E N D
The 10-Year Remote Sensing Industry Forecast Presented at MAPPS Meeting 24 July, 2001 Ron Rabin, Lockheed Martin, Stennis Space Center
Topics • Review Phase I - 10-Year Forecast • Background/Industry Baseline • Results • Phase II - User Needs/Requirements • Status • Preliminary Interview Results • Request for MAPPS Help
It Is Difficult To Make Predictions,Especially About the Future Yogi B. However, ...
The Plan Phase I Characterization and Baseline Forecast of the Industry (Dec 2000) Phase II Characterization of Customers/Users and Determination of Their Needs/Requirements (Jan 2002) Phase IIIValidate I and II (Dec 2003) Technology Assessment Phase IVMarket Forecast (Dec 2004)
Participants • Lockheed Martin • Space Operations • Space Imaging • Kodak • SPOT • EarthData • PAR • Autometrics • Spencer-Gross • American Forests • RAND • Pictometry • Leading Edge • Geomatics • Eaglescan • Landcare Avn. • Univ. of AZ • Univ. of Utah • Univ. of Missouri • RIT • NASA • ASPRS • NSGIC • MAPPS • NOAA • USGS H_E_L_P
Remote Sensing Industry Platforms & Sensors Data Collection Phase I Data Processing Support Elements Industry Intermediaries • Hardware • Software • Etc. • VARs • Consultants • Etc. Business Segments End-User Phase II
Interview Survey Forecast $ $ Time Findings 17% Literature Search Focus Group 20% Conclusions 21% 21% 21% Forecast Process ANALYSIS
Phase I Survey Sample Size * = Excluded Students & Retired
Respondent Profile * Respondents could answer more than once. Respondents are predominantly middle/upper management level with a representative mix of technical and non-technical
Respondent Estimates of CRSI Sales(1998-2001, 2005, and 2010)
Baseline Forecast Based on calculating the average annual growth rate from 1998-2000 (respondent estimates) and applying that rate to the out-years Estimated CRSI Sales III 1998 to 2010 AAGR
Percent of SalesBy Geospatial Activity & Market Segment % of Sales Market Segments • Is this due to marketing practices? Demand? Customer Awareness? • Is there opportunity in the “Lowest % of Sales” market segments?
Most Important Government Missions • Federal level generally has across the • board interest • States appear to be focused more on Natural • Resource Management and Utilities • Only the Federal Government sees • Technology Development as an Important Mission
Most Active RS Markets/Applications/Activities (Generically grouped)(NOT rank ordered)
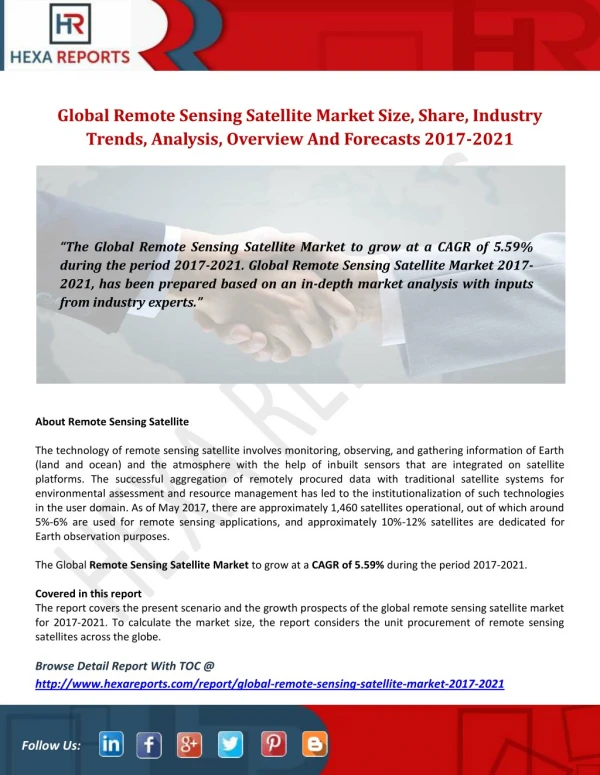
Overall Summary and Conclusions • The Remote Sensing Industry will Grow at about 13% Per Year, Reaching about $6B ($CY2000) in Sales by 2010 • Companies in the RSI are multi-dimensional • more than one Market Segment; • more than one Business Segment; • more than one Geo-Spatial Activity • Currently, Across All Sectors, the most Active Markets/Apps/Activities/ Market Segments are: • Mapping/Geography • Environment • Civil Government • National/Global Security • Transportation • Less Active Market Segments (i.e., Utilities, Real Estate, Insurance, Telecommunications, Agriculture, Forestry, Entertainment/media) may offer a significant opportunity area • Government data distribution policies contribute to a Perception that they may be adversely effecting commercial interests Slide 49
Overall Summary and Conclusions • Photogrammetry is currently the largest area of geo-spatial activity. However, R&D Investments indicate that a Shift to Remote Sensing may be in process • Most RSI Companies are small and do not invest in R&D • There are about 200K employees in the “Core Companies” of the Commercial Sector of the RSI of which 8.75% (about (17K) are Directly Involved in Geo-Spatial Activities. • Ratio is probably higher in smaller companies than in larger ones • College/University Outputs may Not be Meeting Hiring Requirements of Industry. • At Colleges/Universities offering RS curricula, only About 1% of the Student population is enrolled in RS programs. Support for these programs, therefore, is small • Industry competes with Government for personnel resources • Government and/or private sector support are probably needed • Potential Customers may not be fully aware of products available
Topics • Review Phase I - 10-Year Forecast • Background/Industry Baseline • Results • Phase II - User Needs/Requirements • Status • Preliminary Interview Results • Request for MAPPS Help
Collection and Analysis Objectives 1. Identify and Characterize the MANAGER and END-USER • Academic • Instructor • Student • Commercial • Government • Federal • Regional • State • Local • Tribal 2. Identify and Baseline the MANAGER and END-USER Job NEEDS 3. Base-line END-USER NEEDS Survey, Interview, Focus Group Lit. Search Analysis
Collection and AnalysisGoals 4. Determine Needs-driven REQUIREMENTS as Derived from Needs Baseline (Goal 3) 5. Determine If Current APPLICATIONS Provide Cost Effective Solutions to NEEDS and REQUIREMENTS as (Goal 4) 6.Assess Current, Emergent and Future Technology Capabilities to Meet NEEDS, REQUIREMENTS Analysis Analysis Analysis
Upgrade • 1. Insert Existing Technologies • into existing Applications • LIDAR • Radar/SAR/IFSAR • GPS Modernize • 2. Enrich existing Applications • with Emergent Technologies • Electronic/Wireless Information • Hyperspectral • FOPEN Innovate Create • 3. Create New Technologies for New Applications • Micro-electronics/Power • Multi Sensors Platforms • Bandwidth Increase • 4. Create New RS Systems Applications • Unattended Systems • Systems of Systems • Knowledge Based Decision Aids User Driven Applications Development Applications Calibration, Validation, Verification Applications Deployment Phase II User Needs & Requirements Analysis Research
Topics • Review Phase I - 10-Year Forecast • Background/Industry Baseline • Results • Phase II - User Needs/Requirements • Status • Preliminary Interview Results • Request for MAPPS Help
Phase II Interview Results Preliminary/Interim/Initial/Draft and all other Weasel Words
Interviews Conducted at Major Conferences Completed (4) • Association of State Floodplain Managers - 25th annual Conference (31 interviews) • Geospatial World 2001(13 interviews) • Twenty-First Annual ESRI International User Conference • (13 interviews) • National Association of Counties 2001 Annual Conference (13 interviews) Planned (11) Phase II Interview Results Preliminary/Interim/Initial/Draft and all other Weasel Words
Caveats • THIS IS PRELIMINARY ANALYSIS OF VERY COMPLEX DATA. EXPECT CHANGES • Interviewees are fairly evenly split • Imagery and Photography Users (Floodplain Managers) and GIS Users (Geospatial World and ESRI) • Commercial and Government Users • Most of the Government responses come from Federal, State and Local level (Floodplain Mapping) • Manager to User ratio is about 1:4 • Not considered representative of the Academic Sector (3/57) • “Interviewees”, “Respondents” and “Conference Attendees” (and “Potential Customers”) are virtually synonymous
Respondent Profile • Approximately … • 25%-30% Managers • 40% in Software use/development • 20% in Applications Development • Rest are Systems Analysts, Marketers or Trainers • 40% from Mid-Atlantic and Southern states. • 20% have purchasing authority • 20% are Foreign Nationals working with American firms. • 57 Interviews Analyzed: • 31 Floodplain Managers • 13 Geospatial world • 13 ESRI
Applications/Areas of Focus Are the areas of least focus those of biggest opportunity? • In General, The Applications/Areas of Focus most frequently selected by Interviewees parallel the most Active Market Segments in our Phase I Survey • The major exceptions (Utilities and Agriculture) are probably because the Interviewee group has a bias toward Federal, State and Local government interests (Floodplain Managers). • Utilities were also a strong “Mission Activity” at the State Level in the Phase I Survey
Use of Imagery Types • Digital Format is used 3 times more frequently than film. Preference? Trend? Cost? • Imagery collected via Aerial Photography dominates by a 2:1 margin • LIDAR and DOQQ responses are possibly weighted by the size of the Flood Plain Managers group in the sample
Spatial Resolution Use • Higher Spatial Resolutions are used most. • Possibly because the majority of respondents are involved in flood plain mapping - which requires high resolution • Accounting for this bias, it appears that the use of Spatial Resolution is driven by multiple factors, e.g. ... • Using the correct tool for the task at hand • Cost • Availability on the job • Lack of awareness re: tools available … • Not simply the desire for Higher Spatial Resolution
Importance of RS Data/Information Characteristics • Geo-Location Accuracy and Spatial Resolution are the most important characteristics • Cost is a highly important characteristic • Data indicates that Users may value Geo-Location Accuracy and Spatial Resolution enough to be less concerned about Cost, in obtaining those characteristics .
RS Data and/or Information Characteristics Needing Improvement • The Characteristics Interviewees indicated needed most to be improved are the same ones that are of previously selected as being of highest importance - Geo-Location Accuracy and Spatial Resolution • May mean they still aren’t satisfied with accuracy and resolution they have to do their job. • Does not necessarily mean that what’s state of the art wouldn’t • satisfy them, if they were aware and/or it was available • Phase I Interviews discovered a lack of Customer awareness re: RS tools available • Interviewees also indicate that Lower Costs, Data File Size and other characteristics could be improved, but these continue • to be secondary to Geo-Location Accuracy and Spatial • Resolution.
Software Improvements Needed • Ease of Use, Data Format and Software Utility Compatibility • are the software improvements Interviewees deemed most needed • As was the case with Data/Information Characteristics, • Cost is a factor - but not necessarily a driver
Interviewee Comments re: Future of the Industry • Increased growth • Real-time applications • Higher Spatial Resolution and improved Geo-Spatial Accuracy • Smaller data file size with the same information integrity • Faster computers • Standardization of classifications • 3-D Visualization • Lower cost • Technology will continue to advance especially in Lidar • Maneuverable satellites • Quality control • Satellite data automatically processed
Initial Observations (Seeds of Conclusions) • Data/Information derived from Aerial Platform collection is used more than twice as frequently as from Satellites* • Phase II results to date, when coupled with Phase I findings regarding the Satellite and Aerial Imagery markets, raise an interesting issue. • While the Satellite Market is growing, the Aerial Market remains robust and growing as well. • Perhaps the total future market is larger than early and/or current forecasts predict. • Ergo, the Satellite and Aerial Imagery Markets may not be competing and mutually exclusive, but rather complementary and mutually supporting • About 20% of Interviewees (Conference attendees) have authority to purchase RS data, information and/or software (However, some Users can influence purchases) * Also a finding in Phase I Analysis
Initial Observations (Seeds of Conclusions) • The data collected to date says that, in fact, user groups at these Conferences tend to be fairly well clustered around Conference themes. • Corollary: The best way to select Conferences for “marketing” is probably by theme; not by size • When completed, the Interview data will probably present a fairly representative sample of Conference Attendees in general • Cost is important, but does not seem to be the driving Characteristic in terms of desired of data/information/software products. Based on this data, highly valued information (e.g. Geospatial Accuracy and Spatial Resolution) can be used to overcome Cost barriers
Topics • Review Phase I - 10-Year Forecast • Background/Industry Baseline • Results • Phase II - User Needs/Requirements • Status • Preliminary Interview Results • Request for MAPPS Help
Help Collect Survey Responses • The Phase II Survey is aimed at getting sharper insight into the needs of users of remote sensing data, information and software … • Who they are • What they use to do their job • What they need to do their job better • Results (which MAPPSS will receive) will be useful in ... • Business development • Strategic/operational planning • R&D investment decisions • Better customer service • Developing better competitive posture
Survey Plan • Set Phase II Goals and Objectives • Developed Questions • “Culturized” (Commercial, Academia, Government) (ASPRS, MAPPS, NASA, NSGIC) • Develop the Survey (electronic format) • Pre-test Survey (23 July-6 Aug) • Revise Survey (7-17 Aug) • Administer the Survey (20 Aug-12 Oct) • Analyze results: Interviews, Focus Groups, Surveys, Literature Search (21 Aug-20 Apr 2002) • Report • Preliminary. NSGIC 7-12 Sept. and MAPPS/ASPRS 31 Oct-2 Nov • Final. ASPRS 20-25 Apr 2002 Phase II Project Plan
MAPPS Phase II RoleH-E-L-P • Participate in the entire effort to the extent you desire. • Contact: Clark Nelson, SPOT, nelson@spot.com; or, Ron Rabin, LMSO, rrabin@ssc.nasa.gov • Act as a Survey Distributor (along with ASPRS, NSGIC and some Private Companies) • Survey is completely anonymous and voluntary . • Results come directly back to Stennis for analysis. You will see results of analysis, not each response • If you provide mailing list (e-mail or postal) they will be treated as proprietary • We will get the Survey to you via MAPPS. Check it out. Fill it out. • If you think it reasonable and that the information will be useful in developing your business, contact your customers and ask them to complete the survey Participants
ELECTRONICALLY Volunteer Receive Survey URL via internet from MAPPS for your inspection/approval If you elect to continue ... Post Survey URL to your web site and ask your customers to complete or Forward Survey URL to your customer via email and ask your customers to complete or Provide email addresses to NASA (will be treated as “Proprietary”) URL will return surveys to NASA Assist with completion rate reminders PAPER Volunteer Receive Survey via internet from MAPPS or via mail for your inspection/approval If you elect to continue ... Provide mailing addresses list to MAPPS or directly to NASA via internet or US mail (will be treated as “Proprietary”) NASA will mail out Survey and receive results from Respondents Assist with completion rate reminders Assumption will be that all potential respondents are user-managers. Survey will be tailored accordingly Help With Survey Distribution
Participate in Roundtable Discussion • User Areas/Applications of highest interest/most demand • Remote Sensing (RS) Product Awareness (What’s available; What’s needed vs What’s asked for) • Currently, what RS product characteristics are in highest demand? (high resolution, low cost, area coverage, etc) • What do you see as the future direction for Remote sensing Products? (“hardcopy” vs software generated, e-delivered, etc) Technologies? (Digital, hyperspectral SAR/IFSAR, LIDAR, etc) • What are the barriers to market growth? How can they be overcome? • If you could fix one problem in the RS Industry, what would it be?
It Ain’t Over Until It’s OverQUESTIONS? It’s Over