Remote Sensing for Forest Monitoring: Analyzing Change using Landsat Data
This module, developed by experts from the European Commission and Wageningen University, equips participants with the skills to utilize remote sensing techniques to monitor forest area changes. By the end of the course, attendees will be able to differentiate between various remote sensing approaches and perform comprehensive change analyses using Landsat satellite data. The module incorporates background materials from reputable sources like the GOFC-GOLD Sourcebook and data reporting guidelines from the IPCC, ensuring participants gain a thorough understanding of accurate and transparent reporting methodologies for deforestation and land use.

Remote Sensing for Forest Monitoring: Analyzing Change using Landsat Data
E N D
Presentation Transcript
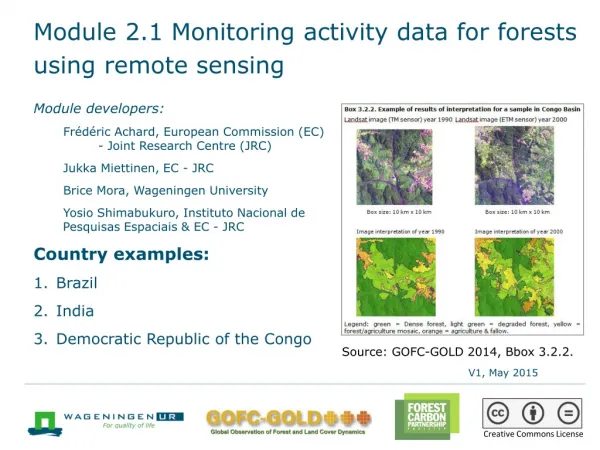
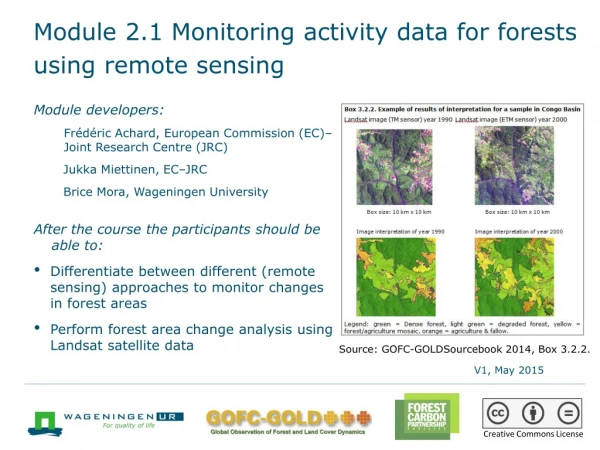
Module 2.1 Monitoring activity data for forests using remote sensing Module developers: Frédéric Achard, European Commission (EC)– Joint Research Centre (JRC) Jukka Miettinen, EC–JRC Brice Mora, Wageningen University After the course the participants should be able to: • Differentiate between different (remote sensing) approaches to monitor changes in forest areas • Perform forest area change analysis using Landsat satellite data Source: GOFC-GOLDSourcebook 2014, Box 3.2.2. V1, May 2015 Creative Commons License
Background material • GOFC-GOLD. 2015. Sourcebook. Sections 1.2, 2.1, 2.7, and 2.9. Section 3.2 for country examples. • UNFCCC. 2011. Decision 1/CP16. The Cancun Agreements. http://unfccc.int/resource/docs/2010/cop16/eng/07a01.pdf#page=2 • IPCC. 2003. Good Practice Guidance for Land Use, Land-Use Change, and Forestry. • GFOI. 2016. Integrating Remote-sensing and Ground-based Observations for Estimation of Emissions and Removals of Greenhouse Gases in Forests: Methods and Guidance from the Global Forest Observation Initiative (MGD). Sections 2.2.1 and 3.
Outline of lecture • Introduction • Selection of a monitoring approach • Image classification and analysis • Accuracy assessment • Limitations to using satellite data
Outline of lecture • Introduction • Selection of a monitoring approach • Image classification and analysis • Accuracy assessment • Limitations to using satellite data
IPCC requirements for measuring and reporting of changes in forest area (1/2) • The IPCC methodologies and UNFCCC reporting principles have been identified as the basis for the REDD+ activities • IPCC methodologies aim for full, accurate, transparent, consistent, and comparable reporting of GHG emissions and removals (e.g., of changes in forest areas) • Reporting also includes a detailed description of the used inventory approach and planned improvements See Module 3.3 on reporting REDD+ performance.
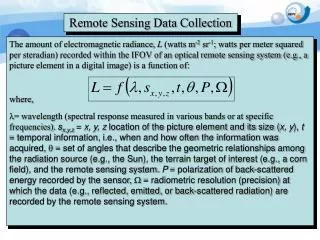
IPCC requirements for measuring and reporting of changes in forest area (2/2) • IPCC guidelines refer to two basic inputs with which to calculate greenhouse gas inventories: activity data and emissions factors. • For activity data, spatially explicit land conversion information, derived from sampling or wall-to-wall mapping techniques, is encouraged.
Key role for earth observation in monitoring tropical forests • Fundamental requirement of national monitoring systems are that they: • Measure changes throughout all forested area • Use consistent methodologies at repeated intervals to obtain accurate results and • Verify results with ground-based or very high resolution observations • The only practical solution to implement such monitoring systems in tropical countries often with low accessibility to forest areas is through interpretation of remotely sensed data supported by ground-based observations.
Issues affecting the selection and implementation of a monitoring approach • Multiple approaches are appropriate and reliable for forest monitoring at national scales. Issues affecting the design of the monitoring system include, for example: • National circumstances, particularly existing definitions and data sources • Decision on change assessment approach, defined by: • Satellite imagery • Sampling versus wall-to-wall coverage • Fully visual versus semi-automated interpretation • Accuracy or consistency assessment • Available resources: • Hard- and software resources • Required training
Outline of lecture • Introduction • Selection of a monitoring approach • Image classification and analysis • Accuracy assessment • Limitations to using satellite data
Required activity data • Depending on national decisions on the approach to be used, the following types of maps may be useful for reporting on the changes in forest cover: • Forest/nonforest map (+ change maps) • National land-cover/land-use map (+ change maps) • Forest stratification • Map of changes within forest land (see Module 2.2) • A monitoring approach suitable for producing the required activity data needs to be selected: a sample of reference data need to be used to produce accurate estimates
Forest definition (1/2) • Currently Annex I parties use the UNFCCC definition of forest and deforestation adopted for implementation of Articles 3.3 and 3.4 of Kyoto protocol. • FAO uses a minimum cover of 10%, height of 5 m and area of 0.5 ha, stating also that forest use should be the predominant land use in the area. • For the Kyoto Protocol, parties should select a single value of crown area, tree height, and area within following ranges: • Minimum forest area: 0.05 to 1 ha • Potential to reach a minimum height at maturity in situ of 2–5 m • Minimum tree crown cover: 10–30 %
Forest definition (2/2) • No agreement on a forest definition currently exists under REDD+. • Countries can choose their own forest definition as long as they clearly describe the definition. • Note that remote sensing imagery allows land cover to be observed; field information is needed to derive land use.
Designation of forest area • Ideally, wall-to-wall assessments would be carried out to identify forested area according to UNFCCC forest definitions. • Alternatively, existing forest maps for a relatively recent time could be used to identify the overall forest extent. • Important principles in identifying the forest extent: • The area should include all forests within the national boundaries • A consistent overall forest extent should be used for monitoring all forest changes during assessment period
Selection of satellite imagery • Many different types of data from optical sensors at a variety of resolutions and costs are available for monitoring deforestation. • The selection of the type of satellite data depends on national circumstances (forest types, size of the country, seasonality, available funds, etc.). • The most commonly used types of satellite data for forest-cover monitoring are listed on the next slide with a summary of their usability for various purposes.
Utility of optical sensors at multiple resolutions for deforestation monitoring Source: GOFC GOLD Sourcebook 2014, table 2.1.1.
Example of a 1 km resolution SPOT VGT image composite for year 2000 covering Southeast Asia Source: JRC, Stibig et al, 2003
Example of forest cover map for insular Southeast Asia derived from 1 km SPOT VGT imagery Evergreen montane forest Evergreen lowland forest Mangrove forest Swamp forest Thickets, shrubs, grassland, and cultivation of perennial crops Cropland Burnt / dry / sparse vegetation Forests burnt in 1988, damage 25%–80% Water Source: JRC, Stibig et al, 2003
Example of forest cover map derived from 30 meter Landsat TM imagery over a site in Brazil Legend Tree cover Tree cover mosaic Other wooded land Other land cover Forest cover map 10 km x 10km window size Centered at 12°S, 58°W Landsat-5 TM image of 15 June 2005: 20 km x 20 km extract Sources: USGS 2015; Eva, et al. 2012.
Decision for wall-to-wall versus sample coverage • Wall-to-wall is a common approach if appropriate for national circumstances. • If resources are not sufficient to complete wall-to-wall coverage, sampling is more efficient for large countries and is needed to produce more accurate estimates of activity data • Recommended sampling approaches are systematic sampling and stratified sampling. See next slide.
Systematic and stratified sampling • Systematic sampling obtains samples on a regular interval, e.g., one every 10 km. • Stratified samples are distributed based on proxy variables derived from coarse resolution satellite data or by combining other geo-referenced or map information. Systematic sampling design Stratified sampling design Source: GOFC-GOLD Sourcebook 2013, box 2.1.2.
Outline of lecture • Introduction • Selection of a monitoring approach • Image classification and analysis • Accuracy assessment • Limitations to using satellite data
Processing of the satellite data • Geometric corrections: • Location error should be < 1 pixel; baseline datasets (e.g.; GLS) can be used as alterative to GCPs or image-to-image registration • Cloud and cloud shadow masking: • Automated or visual methods to ensure meaningfulness of image interpretation • Radiometric corrections: • Depend on the used image interpretation method, not needed for visual single scene interpretation but crucial for automated multitemporal analysis
Geometric correction: example of the use of GLS dataset for image-to-image co-registration 09.09.1990 26.09.1999 04.02.2010 Centered at 25°S, 48°W: Cananéia, Brazil Landsat Scene Source: USGS 2015, GLS dataset.
Radiometric and atmospheric correction: Example of the EC Joint Research Centre automated preprocessing chain Calibrated ETM De-hazed Forest mask Normalized Year 2000 data >>>>>>>>>>>>>>>>>>>>>>>> Automated preprocessing chain Year 2010 data >>>>>>>>>>>>>>>>>>>>>>>> Segmentation and classification Source: Bodartet al. 2011.
Analyzing the satellite data • The selection of the image interpretation method depends on available resources. • Whichever method is selected, the results should be repeatable by different analysts. • Even in a fully automated process, visual inspection of the result by an analyst familiar with the region should be carried out to ensure appropriate interpretation. • The main types of available methods for ~30 m resolution datasets are listed on the next slide, and a few important aspects of selected approaches are highlighted in the following slides.
Main analysis methods for moderate resolution (~ 30 m) imagery Source: GOFC-GOLD Sourcebook 2013,table 2.1.3.
Visual delineation of land entities • Visual delineation of land entities is a viable approach for forest-area monitoring, particularly if image analysis tools and experiences are limited. • The visual delineation of land entities on printouts (used in former times) is not recommended; on screen delineation should be preferred as producing directly digital results. • When land entities are delineated visually, they should also be labeled visually.
Multidate image segmentation • Automated segmentation reduces processing time and increases detail. • It is objective and repeatable. • It delineates changed areas as separate segments. • Ideally, analysis process would include: • Multidate image segmentation on image pairs • Training area/class signature selection • Supervised clustering of individual images • Visual verification and potential editing
Example of semi-automatic multi-date segmentation and change labeling 1990 Paired segmentation Automatic change label 2000 Sources: USGS 2015, GLS dataset; Bodartet al. 2011; and Raši et al. 2011.
Digital classification of image segments • Digital/automatic classification applies only in the case of automatically delineated segments. • Two supervised object classifications run separately on the two multidate images are recommended instead of a single supervised object classification on the image pair. • A common predefined standard training data set of spectral signatures for each type of ecosystem should ideally be used to create initial automated forest maps. • Supervised classification approaches are considered more efficient in the case of a large number of images than unsupervised clustering techniques.
Example of automatic classification using signature database a) b) a) Multitemporalsegmentation (2000–2010) b) Automated classification of the year 2000 Landsat image based on signature database Legend Tree cover Shrub and regrowth Grass, herbaceous Sources: USGS 2015, GLS dataset; Bodartet al. 2011; and Raši et al. 2011.
Example of forest cover change derived from Landsat TM imagery over a site in Brazil Land cover maps of 2001 to 2005 6 August 2001 6 August 2001 Legend Tree cover Tree cover mosaic Other wooded land Other land cover 15 June 2005 15 June 2005 Landsat-5 TM imagery Sources: USGS 2015, GLS dataset; Eva et al. 2012.
Visual verification • Visual verification (or classification) is indispensable. • Verification should take advantage of image pairs. • Existing maps may be used as support. • Single image pairs are preferred over image mosaics. • Spectral, spatial, and temporal (seasonality) characteristics of the forests have to be considered.
Example of visual validation of the automated JRC-FAO assessment results Expert validation with tailored validation Tool Visual Control and Interpretation of automated mapping Source: USGS 2015, GLS dataset; JRC;Simonetti et al. 2011
Outline of lecture • Introduction • Selection of a monitoring approach • Image classification and analysis • Accuracy assessment • Limitations to using satellite data
Basic concepts of an accuracy assessment • Reporting accuracy and verification of results are essential components of a monitoring system. • Accuracy assessment should be based on higher quality data, e.g., in-situ observations or analysis of very high resolution aircraft or satellite data. • Attention needs to be given to the timing of the reference dataset, so that it matches temporally to the dataset that has been used for the forest cover mapping. • Ideally, a statistically valid sampling procedure should be used to determine accuracy; this should lead to quantitative description of the uncertainty of the forest area estimates.
Example of the usability of very high resolution imagery for accuracy assessment LANDSAT 30 m versus Kompsat-2 4 m resolution (RGB: NIR-R-G) Landsat ETM+ Kompsat-2 Source: USGS 2015, GLS dataset; ESA/JRC TropForest project (Kompsat).
Considerations for reporting • Since areas of land-cover change are significant drivers of emissions, providing the best possible estimates of these areas are critical. • It is possible to use the results of a rigorous accuracy assessment to adjust area estimates and to estimate the uncertainties for the areas for each class. • If a statistical approach is not achievable, information obtained through other means can be used to understand the accuracy of the map. Such information may include: • Comparisons to other maps • Systematic review and judgment by local experts • Comparisons to nonspatial statistics
Outline of lecture • Introduction • Selection of a monitoring approach • Image classification and analysis • Accuracy assessment • Limitations to using satellite data
Major sources of limitations • Clouds and cloud shadows • Other atmospheric effects (e.g., haze and smoke) • Effect of topography on reflectance • Insufficient observation frequency (e.g., humid tropics) • Scarcity of historical data • Tradeoff between spatial resolution and coverage • Problems of intersensor comparability (e.g., in historical time series)
Major sources of limitations: Cloud cover • Mean annual cloud cover based on MODIS M3 Product (Cloud Fraction Mean) and EECRA (Extended Edited Cloud Report Archive) Source: Herold 2009.
Major sources of limitations: Scarcity of historical data Actual acquisition year for target year 1990 Actual acquisition year for target year 2000 Source: JRC; Beuchle et al. 2011
In summary • The IPCC guidance and UNFCCC decisions provide general guidelines that should be used to develop national forest definitions and monitoring approaches for REDD+ activities. • Numerous remote sensing data and methods can be used to monitor activity data for forests, preferably with: • Multidate image analysis to detect changes • Supervised, repeatable classification approaches • Visual verification and rigorous accuracy assessment of the resulting maps • Even with the limitations of satellite observation, remote sensing is indispensable for monitoring activity data for forests in tropical countries.
Country examples and exercises Country examples • Brazil (PRODES deforestation monitoring program) • India (FSI: The Forest Survey of India) • Democratic Republic of the Congo (JRC-FAO Systematic sampling) Exercises • Using Landsat time series data to derive forest area change estimates
Recommended modules as follow up • Module 2.2 to proceed with monitoring activity data for forests remaining forests (incl. forest degradation) • Module 2.8 for overview and status of evolving technologies, including, for example, radar data • Modules 3.1 to 3.3 to learn more about REDD+ assessment and reporting
References • Beuchle, R., et al. 2011. “A Satellite Dataset for Tropical Forest Change Assessment.” International Journal of Remote Sensing 32: 7009–7031. doi:10.1080/01431161.2011.611186. • Bodart, C., et al. 2011. “Pre-processing of a Sample of Multi-scene and Multi-date Landsat Imagery used to Monitor Forest Cover Changes over the Tropics.” ISPRS Journal of Photogrammetry and Remote Sensing 66: 555–563. • Eva, H. D., et al. 2012. “Forest Cover Changes in Tropical South and Central America from 1990 to 2005 and Related Carbon Emissions and Removals.” Remote Sensing 4 (5): 1369–1391. doi:10.3390/rs4051369. • FAO (Food and Agriculture Organization). 2010. FAO Forest Resources Assessment of 2010 (FRA). Rome: FAO. http://www.fao.org/docrep/013/i1757e/i1757e.pdf. • FAO. 2015. FAO Forest Resources Assessment of 2015 (FRA). Rome: FAO. http://www.fao.org/forestry/fra/fra2015/en/. • GFOI (Global Forest Observations Initiative). 2014. Integrating Remote-sensing and Ground-based Observations for Estimation of Emissions and Removals of Greenhouse Gases in Forests: Methods and Guidance from the Global Forest Observations Initiative. (Often GFOI MGD.) Geneva, Switzerland: Group on Earth Observations, version 1.0. http://www.gfoi.org/methods-guidance/.
GOFC-GOLD (Global Observation of Forest Cover and Land Dynamics). 2014. A Sourcebook of Methods and Procedures for Monitoring and Reporting Anthropogenic Greenhouse Gas Emissions and Removals Associated with Deforestation, Gains and Losses of Carbon Stocks in Forests Remaining Forests, and Forestation. (Often GOFC-GOLD Sourcebook.) Netherland: GOFC-GOLD Land Cover Project Office, Wageningen University. http://www.gofcgold.wur.nl/redd/index.php. • Hansen, M. C., et al. 2013. “High-resolution Global Maps of 21st-century Forest Cover Change.” Science 342: 850–853. • Herold, M. 2009. An Assessment of National Forest Monitoring Capabilities in Tropical Non-annex I Countries: Recommendations for Capacity Building. Report for The Prince’s Rainforests Project and The Government of Norway. Friedrich-Schiller-Universität Jena and GOFC-GOLD. http://princes.3cdn.net/8453c17981d0ae3cc8_q0m6vsqxd.pdf • IPCC, 2003. 2003 Good Practice Guidance for Land Use, Land-Use Change and Forestry, Prepared by the National Greenhouse Gas Inventories Programme, Penman, J., Gytarsky, M., Hiraishi, T., Krug, T., Kruger, D., Pipatti, R., Buendia, L., Miwa, K., Ngara, T., Tanabe, K., Wagner, F. (eds.). Published: IGES, Japan. http://www.ipcc-nggip.iges.or.jp/public/gpglulucf/gpglulucf.html (Often referred to as IPCC GPG) • Raši, R., et al. 2011. “An Automated Approach for Segmenting and Classifying a Large Sample of Multi-date Landsat-type Imagery for pan-Tropical Forest Monitoring.” Remote Sensing of Environment 115: 3659–3669.
Simonetti, D., et al. 2011. User Manual for the JRC Land Cover/Use Change Validation Tool. EUR - Scientific and Technical Research Reports. Brussels: Publications Office of the European Union. http://publications.jrc.ec.europa.eu/repository/handle/111111111/16104. • Stibig, H.J., et al. 2003. “Mapping of the Tropical Forest Cover of Insular Southeast Asia from SPOT4-Vegetation Images.” International Journal of Remote Sensing 24 (18): 3651–3662. • USGS (US Geological Survey). 2015. Global Land Survey (GLS) Datasets. Last modified April 20, 2015. http://glovis.usgs.gov/.