Download
1 / 20
200 likes | 368 Vues
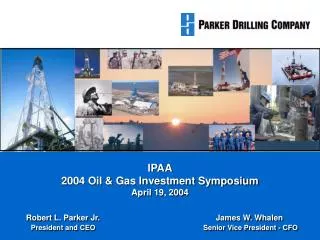
IPAA 2004 Oil & Gas Investment Symposium April 19, 2004. Robert L. Parker Jr. James W. Whalen President and CEO Senior Vice President - CFO. Forward Looking Statements.

E N D
IPAA2004 Oil & Gas Investment SymposiumApril 19, 2004 Robert L. Parker Jr. James W. WhalenPresident and CEOSenior Vice President - CFO
Forward Looking Statements The following presentation contains certain statements that may be deemed to be “forward-looking statements” within the meaning of the Securities Acts. All statements, other than statements of historical facts, that address activities, events or developments that the Company expects, projects, believes or anticipates will or may occur in the future, the outlook for rig utilization and dayrates, general industry conditions including bidding activity, future operating results of the Company’s rigs and rental tool operations, capital expenditures, asset sales, expansion and growth opportunities, financing activities, debt repayment and other such matters, are forward-looking statements. Although the Company believes that its expectations stated in this presentation are based on reasonable assumptions, actual results may differ from those expressed or implied in the forward-looking statements. For a more detailed discussion of risk factors, please refer to the Company’s reports filed with the SEC, and in particular, the report on Form 10-K for the year ended December 31, 2003. Each forward-looking statement speaks only as of the date of this presentation, and the Company undertakes no obligation to publicly update or revise any forward-looking statement.
Investment Highlights • Geographic and asset diversification • Significant presence in core international markets • High margin rental tool business • Outstanding safety record • Favorable industry outlook • Experienced management team
Parker Drilling Overview • Leading worldwide provider of contract drilling and related services • Among the most geographically diverse drilling contractors in the world – operated in 50 countries and U.S. since inception in 1934 • Reputation for operational expertise and experience in drilling in unique and challenging environments • Core operating areas include: • International land drilling focused in CIS and Asia Pacific region • International offshore drilling focused in Caspian Sea and Nigerian transition zones • U.S. barge drilling in GOM • Quail Tools provides premium rental tools for land and offshore drilling and workover activities • High margin business serving major and independent producers in the GOM, West Texas and Rockies
Non-Core Assets • Non-core assets comprised of GOM jackups and platforms and Latin America rigs • GOM jackups and platforms • 6 shallow water jackups capable of drilling in 9 to 215 feet of water • 4 platform rigs • Latin America land rigs • 16 rigs located in Colombia, Peru, Bolivia and Argentina • Non-core assets written down to $145.6 million in 2003 • Parker may sell other assets in addition to non-core assets
Geographic and Asset Diversification Rig Key Land Platform Jackup Project Barge Management Russia Kazakhstan Turkmenistan Sakhalin Gulf of Mexico Bangladesh China Colombia Kuwait Papua New Guinea Nigeria Indonesia Chad Peru Bolivia New Zealand
Status of GOM Business Rig TypeUtilizationCurrent 4Q033Q03 Jackup Rigs 4/6 $ 23,300 $ 21,800 $ 20,200 Deep Barges 8/9* $ 20,300 $ 18,500 $ 18,400 Interm. Barges 1/5 $ 15,500 $ 14,400 $ 14,000 Workover Barges 3/7 $ 11,100 $ 10,400 $ 10,700 Platform Rigs 1/4 $ 20,500 $ 17,400 $ 13,300 17/31 = 55% Utilization * Rig 53B currently in shipyard preparing to move to Mexico
Revenues and Operating Income Sources 2003 Revenues 2003 Operating Income Discontinued Ops - 9% Discontinued Ops. - 19% US Offshore 16% US Offshore 18% Asia Pacific – 6% Asia Pacific 8% Quail 14% CIS 24% Quail 26% CIS 21% Int’l Offshore 20% Int’l Offshore 19% Total = $385.9 million (includes Discontinued Operations) Total = $122.2 million (includes Discontinued Operations)
High Margin Rental Tool Business Project Mgmt. 11% International Offshore 19% Quail Tools 12% U.S. Offshore 29% International Land 29% • Quail Tools provides premium rental tools for deep water and land drilling operations • Consistent high margin business even during down cycles • Significant contributor to Parker Drilling’s cash flow • Four locations in Louisiana, South Texas, West Texas and Wyoming
Outstanding Safety Record Project Mgmt. 11% International Offshore 19% Quail Tools 12% U.S. Offshore 29% International Land 29% Total Recordable Incidence Rate (1) (1) TRIR = Recordable Incidents/100 Workers per Year
Business Strategies • Today: • Significantly reduce debt and enhance liquidity • Increase utilization of barge and land rigs • Control costs / minimize capital expenditures • Tomorrow: • Pursue strategic growth opportunities
Significantly Reduce Debt • Goal: debt reduction of $200 million • Asset sales, cash on hand, operating cash flow • Term Loan provides additional flexibility • Near-Term target: debt to capital ratio of 55-60%
Increase Utilization • Utilization rates have been at historically low levels • Parker has restructured management and marketing infrastructure for its various operating segments • Relocated personnel closer to customers’ key decision makers • Each operating segment held accountable for its profitability • Revised compensation structure
Control Costs / Minimize Capex • Continue ongoing cost reduction programs • Below $20 million for 2003 G&A expense (compared to $24.7 million in 2002) • Minimize capital expenditures • Spent $35 million in 2003, well below budget of $50 million • Budget of $50 million in 2004 • Limit spending to maintenance and high return projects • Active preventive maintenance program • Only after balance sheet has been stabilized and operations are in order, pursue a prudent growth plan
Favorable Industry Outlook • Despite continued strength in oil and gas prices, day rates and utilizations in most of the Company’s drilling markets were at historically low levels in 2003 • E&P companies addressing a number of issues including debt reduction and lack of acceptable well prospects • E&P expenditures are expected to increase in 2004 • Industry research projects 2004 expenditures to increase 4-10% • Continued strength in commodity prices and increase in worldwide rig count should lead to rebound in the near-term
Historical Commodity Prices • Oil and gas prices continue to remain strong relative to historical levels Source: Bloomberg
Historical Utilization Rates • As seen by the utilization rates below, Parker’s sector of the drilling industry is in a down cycle 2000 2001 2002 2003 Transition Zone Rigs U.S. Barge Deep Drilling 92% 93% 78% 78% U.S. Barge Intermediate Drilling 93% 80% 38% 30% U.S. Barge Workover & Shallow Drilling 44% 53% 32% 31% International Barge Drilling 97% 97% 85% 76% Offshore Rigs Jackup Rigs 86% 78% 80% 82% Platform Rigs 53% 47% 9% 18% Land Rig Data International Rigs 35% 49% 42% 32%
Historical Financial Performance Project Mgmt. 11% International Offshore 19% Quail Tools 12% U.S. Offshore 29% International Land 29% Revenues and Operating Income includes Discontinued Operations (1) Drilling & Rental Operating Income excludes Depreciation
Outlook • Asset sales process is ongoing • Remain committed to reduce debt by $200 million • GOM market should improve in 2004 • Increase in utilization expected with a number of new contracts beginning by mid-January • International markets expected to continue to improve • CIS experiencing increased activity; Parker’s presence growing • Asia-Pacific activity improving • Opportunities in Middle East • Outlook for Quail Tools is positive • Recent improvements in GOM rental activity • Rocky Mountain location continues to grow


![The CENVAT Credit Rules, 2004. [ Notification no. 23/2004-C.E. (NT) dated 10.09.2004]](https://cdn3.slideserve.com/5711726/the-cenvat-credit-rules-2004-notification-no-23-2004-c-e-nt-dated-10-09-2004-dt.jpg)