Download
1 / 49
490 likes | 616 Vues
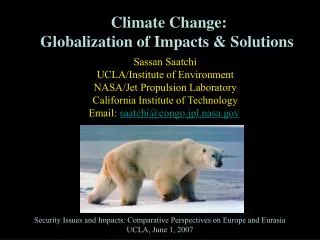
Climate Change: Globalization of Impacts & Solutions. Sassan Saatchi UCLA/Institute of Environment NASA/Jet Propulsion Laboratory California Institute of Technology Email: saatchi@congo.jpl.nasa.gov. Security Issues and Impacts: Comparative Perspectives on Europe and Eurasia

E N D
Climate Change: Globalization of Impacts & Solutions Sassan Saatchi UCLA/Institute of Environment NASA/Jet Propulsion Laboratory California Institute of Technology Email: saatchi@congo.jpl.nasa.gov Security Issues and Impacts: Comparative Perspectives on Europe and Eurasia UCLA, June 1, 2007
Climate Change The Environmental Consequences of Growth • Climate change is a global problem caused by human activities at local, regional, global scale • Roots of environmental changes are deeply embedded in processes that generate economic growth • Mitigation of effects of climate change challenges our economic views of growth, progress, and basic human food and energy consumption
Vostok: Past climate and CO2 Petit et al., Nature, 1999
Carbon Cycle:Carbon cycles through pools or reservoirs of carbon on land, in the ocean, and in sedimentary rock formations over daily, seasonal, annual, millennial and geological time scales.
Climate Change & Human Activity What is the Global Carbon Cycle?
The 1:1 relationship between GDP and CO2 emissions can be de-linked
u Industrialized Pacific l Western Europe Vehicles per Thousand People:U.S. Compared to Other Countries Historical U.S. Vehicles Compared to Vehicles per 1000 People around the World United States Vehicles per 1000 People Eastern Europe Middle East n Former USSR Africa l Central & S. America u l n u Developing Asia China n Sources:U.S. dataVehicles: U.S. Department of Transportation, Federal Highway Administration, Highway Statistics 2000, Table VM-1, and earlier annual editions.Population: U.S. Department of Commerce, Bureau of the Census Time Series of National Population Estimates: April 1, 2000 to July 1, 2001Other countries/regionsEnergy Information Administration, International Energy Outlook 2002, DOE/EIA-0484(2002), p. 256.
Global Carbon Cycle Keeling Curve Houghton, 1998
1984 1997
Metrics for “Dangerous” Change Extermination of Animal & Plant Species 1. Extinction of Polar and Alpine Species 2. Unsustainable Migration Rates Ice Sheet Disintegration: Global Sea Level 1. Long-Term Change from Paleoclimate Data 2. Ice Sheet Response Time Regional Climate Change 1. General Statement 2. Droughts/Floods
Recent increases in the growing season length at high northern latitudes 0 50 100 150 200 0 100 200 300 0 100 200 300 Day of Thaw Day of Freeze Growing Season Length (days) 1998 Anomaly Smith, Saatchi, Randerson [2004]
Mapping changes in global net primary production near real-time depiction of the droughts in the Amazon and Horn of Africa, May 2005
Increasing Fire: A Smoking Gun for Changing Climate? Large Fires Alaska and Canada 1980 – 1990 M. Flannigan, T. Swetnam et al
Case Study in Ecotone Region of Cameroon Economic Commission For Africa, 2001
MODIS Change Detection Percent Woody Cover 0-30% 31-60% 61-100% Hecht & Saatchi, BioScience,in press 2007 1-30%
Global terrestrial net uptake of carbon peaks during the 21st century then levels off or declines
21st Century Global Warming Climate Simulations for IPCC 2007 Report ►Climate Model Sensitivity 2.7-2.9ºC for 2xCO2 (consistent with paleoclimate data & other models) ►Simulations Consistent with 1880-2003 Observations (key test = ocean heat storage) ►Simulated Global Warming < 1ºC in Alternative Scenario Conclusion: Warming < 1ºC if additional forcing ~ 1.5 W/m2 Source: Hansen et al., to be submitted to J. Geophys. Res.
The annual mean change of temperature (map) and the regional seasonal change (upper box: DJF; lower box: JJA) for the scenarios A2 and B2
The annual mean change of precipitation (map) and the regional seasonal change (upper box: DJF; lower box: JJA) for the scenarios A2 and B2
Climate change and other environmental issues are inter-linked
Methods to Reduce CO2 Emissions 1.Energy Efficiency & Conservation More Efficient Technology Life Style Changes 2.Renewable & CO2-Free Energy Hydro Solar, Wind, Geothermal Nuclear 3.CO2 Capture & Sequestration No Silver Bullet All Three are Essential
The World Needs Clean, Low-Cost Energy • Affluence • is not just money… • Adequate, clean water • Good health • Education Affluence Japan United States France United Kingdom South Korea Mexico Poland El Salvador Russia China Poverty Bangladesh Burkina Faso Source: Energy Information Administration, International Energy Annual 2000 Tables E1, B1, B2; Gross Domestic Product per capita is for 2000 in 1995 dollars. Updated May 2002
Saudi Arabia 26% Iraq 11% Kuwait 10% Iran 9% UAE 8% Venezuela 6% Russia 5% Mexico 3% Libya 3% China 3% Nigeria 2% U.S. 2% U.S. 26% Japan 7% China 6% Germany 4% Russia 3% S. Korea 3% France 3% Italy 3% Mexico 3% Brazil 3% Canada 3% India 3% U.S. Dependence on Foreign Oil Have Oil Use Oil The U.S. uses more than the next 5 highest consuming nations combined. Updated August 2002. Source: International Energy Annual 1999 (EIA), Tables 1.2 and 8.1.
Resource data may imply a change in the energy mix and the introduction of new sources of energy during the 21st century
Key Message Environment Supply Demand Josef Koudelka/CHAOS LEBANON. Beirut. City centre. 1991.