Download

1 / 76
770 likes | 997 Vues
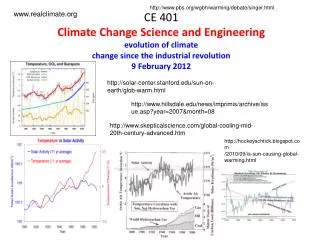
CE 401 Climate Change Science and Engineering modeling of climate change predictions from models 21 February 2021. team selection and project topic proposal (paragraph): due TODAY 2/21 poster project due Thursday - electronically exam on first half of class: 3.1.2012.

E N D
CE 401 Climate Change Science and Engineering modeling of climate change predictions from models 21 February 2021 team selection and project topic proposal (paragraph): due TODAY 2/21 poster project due Thursday - electronically exam on first half of class: 3.1.2012
some pre-warned questions for the exam on the 1st : • what is the average global percent increase in [CO2]/yr since 1959? • what is the solar energy input [w/m2] at the top of the Earth’s atmosphere? • what is the average albedo of the Earth [%]? • what is the solar cycle variability in solar output measured at top of Earth’s atmosphere? [%] • how many degrees [°C] is the Earth warmer with greenhouse gases than without? • what ~ percent of global carbon emissions stays in the Earth’s atmosphere? • what is the pre-industrial (1750) level of [CO2] [ppm]? • what is the current level of [CO2] [ppm]? • the carbon cycle • where does CO2 come from and where does it go • key components of the climate system • what goes into a climate model • what are feedback mechanisms
where are we in the syllabus: latest version always on website
components of the system speeds in the system source: IPCC 2007 The Climate System - very complicated
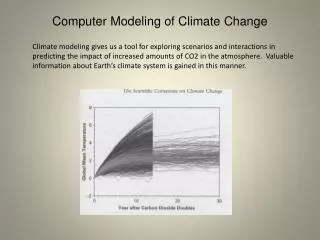
modeled global temperature changes from various [CO2] changes
feedbacks are important and modify “normal” models significantly
summary of model results for feedbacks Figure 8.14 climate feedback parameters: WV=water vapor, C=cloud, A=albedo,LR=lapse rate, IPCC
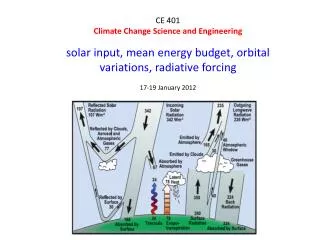
relative radiative forcings 1890 – 1990 from models solar Figure 9.1 volcanoes pressure height above surface GHG ozone sulphate aerosol total components of modeled global temp change 1890-1990 (a) solar forcing, (b) volcanoes, c) GHG, (d) tropospheric and stratospheric ozone changes, (e) sulphate aerosol forcing, (f) sum of all forcings, for 1000mb to 10 mb, 0 - 30 km.
what does the IPCC have to say about models and the past 100 years detection and attribution of causes
basis for attribution of causes for climate change: • detection: process of demonstrating that climate has changed in some defined • statistical sense, without providing a reason for that change • attribution of causes: process of establishing the most likely causes for the detected • change with some defined level of confidence.
precipitation – obsvd & modeled observed mean annual precip (cm) for 1980-1999 Figure 8.5 multi-model mean same time period do predictions agree with observations IPCC
With human-induced influence Without human-induced influence Observations Natural + Human-induced Natural Observations and Model ComparisonTemperature Change, 1900 - Present black = observations red = modeled natural + humanblue = modeled natural alone
influence of anthropogenic and natural radiative forcings in models: • significant cooling due to aerosols is a robust feature of a wide range of detection • analyses • GHG by themselves would have caused more than the observed warming • high variance between models - how to identify the aerosol fingerprint (short life) • using nearly any solar model shows that solar forcing cannot match the observed change • nonlinearities are not understood (e.g. do forcings just add - most assume this)
synthesis of observed & modeled climate changes – IPCC 2007
basis for attribution of causes for climate change: • detection: process of demonstrating that climate has changed in some defined • statistical sense, without providing a reason for that change • attribution of causes: process of establishing the most likely causes for the detected • change with some defined level of confidence. IPCC statements on Detection “little observational evidence of a detectable human influence on climate” 1990 Report “The balance of evidence suggests a discernible human influence on global climate” 1995 Report “There is new and stronger evidence that most of the warming observed over the last 50 years is attributable to human activities”, “warming over the 20th century is very unlikely to be due to internal variability alone as estimated by current models” 2001 Report “the observed widespread warming of the atmosphere and ocean, together with icemass loss, support the conclusion that it is extremely unlikely that global climatechange of the past 50 years can be explained without external [human] forcing, and very likely that it is not due to known natural causes alone.” 2007 Report this is the “scientific” consensus, is it right?
contrarians I have been dismayed over the bogus science and media hype associated with the (dangerous) human-induced global warming hypothesis. My innate sense of how the atmosphere-ocean functions does not allow me to accept these scenarios. Observations and theory do not support these ideas. (Professor Emeritus William Gray, CSU, 2006) Predictions of harmful climatic effects due to future increases in hydrocarbon use and minor GHG like CO2 do not conform to current experimental knowledge, Robinson et al, 2007 On the most important issue, the IPCC’s claim that “most of the observed increase in global average temperatures since the mid-twentieth century is very likely due to the observed increase in anthropogenic greenhouse gas concentrations [emphasis in the original],” NIPCC reaches the opposite conclusion — namely, that natural causes are very likely to be the dominant cause. Non-governmental International Panel on Climate Change (NIPCC - http://www.nipccreport.org/)
Climate Projections for the 21st century(based on the models)
results of the models – the predictions and the assignment of cause - are a very polarizing issue Revelle and Suess (1957):“human beings are now carrying out a large scale geophysical experiment of a kind that could not have happened in the past nor be reproduced in the future. Within a few centuries we are returning to the atmosphere and oceans the concentrated organic carbon stored in sedimentary rocks over hundreds of millions of years” Singer , Hot Talk, Cold Science (1997):Industrialized nations are poised to adopt policies that will cost hundreds of billions of dollars “to mitigate disasters that exist only on computer printouts and in the feverish imaginations of professional environmental zealots”
the models use a set of economic scenarios, from “business as usual” = just • keep ramping up carbon useage (A2), to models that take into account economic changes to a service/inofrmation based economy with reductions in • material intensity and use of clean and resource-efficient technologies (B1) • scenario assumptions: • fossil fuel use • population change • economic growth • technological innovation • attitudes to social and environmental sustainability • land use change
various scenarios of warming based on various economic models Figure 10.4 multi-model means of surface warming relative to 1980-1999 for various scenarios. Shading shows 1 std dev range. B1, A1B, A2 are low, med, hi scenarios. # give number of models run into that period IPCC 2007
Figure 10.12 multimodel mean changes for A1B scenario – 2090 relative to 1990
extreme events: • increased risk of more intense, more frequent and longer lasting heat waves • decrease in the diurnal temp range in most regions • fewer frost days • longer growing season • increased summer dryness and winter wetness in NH midlats and high lats • increase in extreme rainfall intensity • evidence that future tropical cyclones could be come more severe
as it usually appears in print - not adjusted for a baseline $$ - and in Al Gore’s film same data adjusted for a baseline $$
Projected changes in annual temperatures for the 2050s source: GISS BW 11 The projected change in annual temperatures for the 2050s compared with the present day, when the climate model is driven with an increase in greenhouse gas concentrations equivalent to about 1% increase per year in CO2
-30% -10 0 10 +30%
Change in January Average Daily Maximum Temperature (doubling of CO2) source: Hotchkiss and Stone (2000)
Change in July Average Daily Precipitation (doubling of CO2) source: Hotchkiss and Stone (2000)
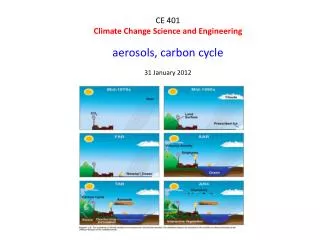
Color Code: Temperate forests Grasslands Deserts Savanna Tropical seasonalforest Tropical moistforest Ice Tundra Boreal forests Vegetation Changes for Modeled Doubling of Carbon Dioxide Present now CO2doublingby 2050 x 2 CO2 source: IPCC, 1996
Changescurrent --> 2050Peak 8-Hr Ozone [ppbv](EPA Standard = 80 ppbv)WSU/LAR - Lamb et al. Future Current ozone air pollution Difference difference
winter summer Precipitation increases very likely in high latitudes Decreases likely in most subtropical land regions
temp increases: 2.2F/2025, 3.5F/2045, 5.9F/2080 • April 1 snowpack down by 30% across state by 2025, down 40% by 2045 • primary impact on Puget Sound will be a shift in the timing of peak river flow • from late spring to late winter • shorter irrigation season • annual hydro production will decrease by a few % • reservoir systems will likely be less able to supply water to all users – 30% by 2025 • due to increased summer temps, area burned by fire is expecdted to double by 2045 • rising stream temps will likely reduce quality and extent of salmon habitat • warming is expected during all seasons • sea level increases 2-13 inches by 2100 • projected changes in annual precipitation averaged over all models are small (1-2%) • impact of climate change on crops will be mild in short term with increasing effects • yields of dry land wheat will increase 2-8% by 2025