Download
1 / 35
350 likes | 522 Vues
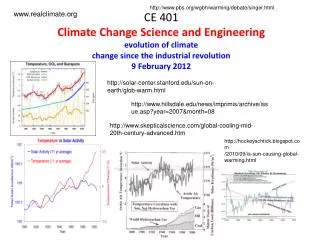
http://www.pbs.org/wgbh/warming/debate/singer.html. www.realclimate.org. CE 401 Climate Change Science and Engineering evolution of climate change since the industrial revolution 9 February 2012. http://solar-center.stanford.edu/sun-on-earth/glob-warm.html.

E N D
http://www.pbs.org/wgbh/warming/debate/singer.html www.realclimate.org CE 401 Climate Change Science and Engineering evolution of climate change since the industrial revolution 9 February 2012 http://solar-center.stanford.edu/sun-on-earth/glob-warm.html http://www.hillsdale.edu/news/imprimis/archive/issue.asp?year=2007&month=08 http://www.skepticalscience.com/global-cooling-mid-20th-century-advanced.htm http://hockeyschtick.blogspot.com /2010/09/is-sun-causing-global-warming.html
where are we in the syllabus: latest version always on website
TERM PAPER/ORAL PRESENTATION TOPIC DUE 2/21/2012 – LESS THAN 2 WEEKS • sample topics from other classes: • carbon sequestration from power plants • biofuel impacts on CO2 emissions • aerosols and climate change • wind energy as a renewable resource • solar voltaic cells • sustainable options and climate change POSTER PROJECT DUE 2/23/2012 (2 WEEKS)
Global CO2 distribution in ppm 380 parts / million 372 ppm
NASA Global Temperature Record 1880 - 2008 • last decade is the warmest decade on record • increase in past 25 years is ~ 0.2°C/decade • why the leveling off/cooling in the 50’s? – CO2 record • is very smooth – no big bumps and wiggles source: GISS, 2010
NASA Global SURFACE Temperature Record 1880 - 2008 source: GISS, 2010
surface temps are different than temps above the earth surface - how good is the surface record – where do satellites measure huge discussions about “where” to measure temp e.g. stratosphere shows cooling
altitude dependent weighting functions for satellite temp sensitivity NOAA satellites measure temperature from space, but not at the surface
temperature anomaly vs time 1960 – 2006 as obsv by satellite stratosphere mid troposphere lower troposphere actual surface
What are some of the problems with these graphs of surface temperature vs time? There are lots of problems with these graphs!! name some
where is temperature data collected (geographic distribution) • how is temperature collected? (same method everywhere?) • what affects the reading of the thermometer? (surroundings) • consistency of measurement method over a period of years
urban heat island effect California weather stations California surface weather stations Robinson et al (2007): Surface temperature trends 1940-1996 from 107 measuring stations in 49 CA counties. Trends combined for counties of similar population. The “X” show the stations used by NASA GISS for their estimate of global surface temperatures. original source: F. Singer, Hot Talk, Cold Science, 1997
how would you go about quantifying the urban heat island effect? e.g. where are the urban areas?
current locations of global thermometers source, J Geophys Res.,2003
NOAA 2010 tied 2005 as the hottest year on record UK Met office: 2011 11th hottest year on record; data confirms the overall warming trend since 1860. Of the 10 warmest years on record, nine occurred since 2000. Each successive decade since 1950 has been warmer than the last.
sea surface temperature 1850 - 2004 models red = observations source: IPCC 2007 what are potential problems with this graph?
sea level change 1880 - 2004 red: reconstructed sea level fields since 1870 (Church and White, 2006) blue: coastal tide measurements since 1950 (Holgate/Woodworth 2004) black: satellite altimetry (Leudiette et al, 2004) source: IPCC 2007
Figure 5.1 Global ocean heat content 0-700m layer. shading = 90% confidence. source: IPCC 2007
total column water vapor in %/decade monthly averages 1988 – 2004 over ocean
Snow cover and Arctic sea ice are decreasing (area vs time) Spring snow cover in millions of square km 1920 - present glaciers are retreating Arctic sea ice area decreased by 2.7% per decade 1979 - 2005 source: IPCC, 2007
Glaciers and frozen ground are receding area of seasonally frozen ground in NH has decreased by 7% from 1901 to 2002 increased Glacier retreat since the early 1990s source: IPCC 2007
Palmer Drought Severity Index 1900 - 2002 source: IPCC, 2007
% time during year when temps were below 10th percentile for cold nights or above the 90th percentile for warm nights: black 1901-1950, blue 1951-1978, orange 1979-2003
detection of significant change is a statistical problem: • finding a small signal in a sea of poorly understood noise • the instrumental record is short --> rely on proxy measurements • changes have obviously occurred over the past 100 years that are • not human related • if an observed change in the record is judged unlikely to have occurred • due to natural processes --> implicates human factors (???) • assignment of attribution to a human cause requires consideration • and elimination of all plausible non-human mechanisms • can’t eliminate all plausible mechanisms • cause and effect are usually approached with a series of controlled • experiments, but this cannot be done in this case • experiment is not systematic - too many parameters are being changed at one time
Annual mean Smoothed series 5-95 decadal error bars Global Mean Temperatures 11 of the past 12 years are the hottest on record source: IPCC = Intergovernmental Panel on Climate Change, 2007