Download
1 / 33
350 likes | 535 Vues
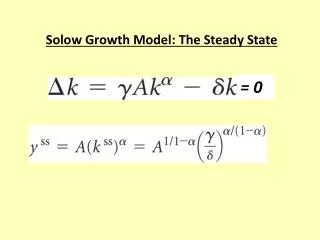
Dynamic Causal Model for Steady State Responses. Rosalyn Moran Wellcome Trust Centre for Neuroimaging. DCM for Steady State Responses. A dynamic causal model (DCM) of steady-state responses in electrophysiological data is summarised in terms of their cross-spectral density. Where

E N D
Dynamic Causal Model for Steady State Responses Rosalyn Moran Wellcome Trust Centre for Neuroimaging
DCM for Steady State Responses A dynamic causal model (DCM) of steady-state responses in electrophysiological data is summarised in terms of their cross-spectral density. Where These spectral data-features are generated by a biologically plausible, neural-mass model of coupled electromagnetic sources; where each source comprises three sub-populations. Under linearity and stationarity assumptions, the model’s biophysical parameters (e.g., post-synaptic receptor density and time constants) prescribe the cross-spectral density of responses measured directly (e.g., local field potentials) or indirectly through some lead-field (e.g., electroencephalographic and magnetoencephalographic data). Inversion of the ensuing DCM provides conditional probabilities on the synaptic parameters of intrinsic and extrinsic connections in the underlying neuronal network
Overview • Data Features • The Generative Model in DCMs for Steady-State Responses - neural mass model • Bayesian Inversion: Parameter Estimates and Model Comparison • Example. DCM for Steady State Responses: • Glutamate with Microdialysis validation • Predicting Anaesthetic Depth
Overview • Data Features • The Generative Model in DCMs for Steady-State Responses - neural mass model • Bayesian Inversion: Parameter Estimates and Model Comparison • Example. DCM for Steady State Responses: • Glutamate with Microdialysis validation • Predicting Anaesthetic Depth
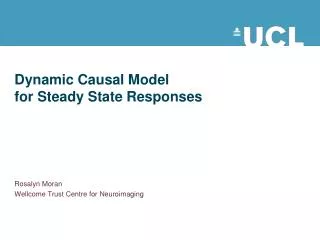
Steady State Statistically: A “Wide Sense Stationary” signal has 1st and 2nd moments that do not vary with respect to time Dynamically: A system in steady state has settled to some equilibrium after a transient Data Feature: Quasi-stationary signals that underlie: Spectral Densities in the Frequency Domain
30 25 20 15 10 5 0 0 5 10 15 20 25 30 Steady State 30 25 Source 2 Power (uV2) 20 15 10 5 0 0 5 10 15 20 25 30 Frequency (Hz) Source 1 Power (uV2) Frequency (Hz)
Cross Spectral Density 1 EEG - MEG – LFP Time Series 2 Cross Spectral Density 3 1 2 4 1 2 3 4 3 4
Cross Spectral Density Vector Auto-regression a p-order model: Linear prediction formulas that attempt to predict an output y[n] of a system based on the previous outputs Resulting in a matrices for c Channels Cross Spectral Density for channels i,j at frequencies
Overview • Data Features • The Generative Model in DCMs for Steady-State Responses - neural mass model • Bayesian Inversion: Parameter Estimates and Model Comparison • Example. DCM for Steady State Responses: • Glutamate with Microdialysis validation • Predicting Anaesthetic Depth
DCM Hemodynamicforward model:neural activityBOLD (nonlinear) Electric/magnetic forward model:neural activityEEGMEG LFP (linear) Neural state equation: fMRI ERPs Neural model: 1 state variable per region bilinear state equation no propagation delays Neural model: 8 state variables per region nonlinear state equation propagation delays inputs
DCM for SSRs Electric/magnetic forward model:neural activityEEGMEG LFP (linear) Hemodynamicforward model:neural activityBOLD (nonlinear) Electric/magnetic forward model:neural activityEEGMEG LFP (linear) Neural state equation: SSRs fMRI ERPs Neural model: 8-10 state variables per region propagation delays linearised model modulation transfer function Neural model: 1 state variable per region bilinear state equation no propagation delays Neural model: 8 state variables per region nonlinear state equation propagation delays inputs
inhibitory interneurons spiny stellate cells pyramidal cells Neural Mass Model MEG/EEG/LFP signal The state of a neuron comprises a number of attributes, membrane potentials, conductances etc. Modelling these states can become intractable. Mean field approximations summarise the states in terms of their ensemble density. Neural mass models consider only point densities and describe the interaction of the means in the ensemble Extrinsic Connections Intrinsic Connections neuronal (source) model Internal Parameters State equations
Neural Mass Model A F,L,B inhibitory interneurons 1. Synaptic Input Sigmoid Response Function spiny stellate cells Firing Rate pyramidal cells 2. Synaptic Impulse Response Function Membrane Potential v Amplitude (E/IPSP) Time msec (E/IPSP)
= x x & 7 8 = k + g - k - k 2 x H ( B I ) S ( x ) 2 x x & 8 e e 3 9 e 8 e 7 = x x & 10 11 = k g - k - k 2 x H S ( x ) 2 x x & 11 i i 5 12 i 11 i 10 = - x x x & 12 8 11 = x f ( x , u ) & = x x & 1 4 = k + g + - k - k 2 x H (( F I ) S ( x ) Cu ) 2 x x & 4 e e 1 9 e 4 e 1 = x x & 2 5 = k + g - k - k 2 x H ( BS ( x ) S ( x )) 2 x x & 5 e e 9 2 1 e 5 e 2 m = x & 3 6 = k g - k - k 2 x H S ( x ) 2 x x & 6 i i 4 12 i 6 i 3 = - x x x & 9 5 6 Neural Mass Model Lateral connections inputs Intrinsic connections Inhibitory cells in supragranular layers Inhibitory cells in supragranular layers g g g g 5 5 5 5 Backward connections g g g g g g g g 4 4 4 4 3 3 3 3 Excitatory spiny cells in granular layers Excitatory spiny cells in granular layers constant input = = x x x x & & 1 1 4 4 = = k k g g - - + + - - k k - - k k u u 2 2 x x H H ( ( s s ( ( x x a a ) ) u u ) ) 2 2 x x x x & & 4 4 e e e e 1 1 9 9 e e 4 4 e e 1 1 g g g g g g g g 1 1 1 1 2 2 2 2 Excitatory pyramidal cells in infragranular layers Excitatory pyramidal cells in infragranular layers output Forward connections
ERP or Steady State Responses + Freq Domain Output ERP Output Outputs Through Lead field c1 c2 c3 Time Domain neuronal states Time Domain Freq Domain output s2(t) output s3(t) output s1(t) Pulse Input Freq Domain Cortical Input driving input u(t)
Frequency Domain Generative Model(Perturbations about a fixed point) Transfer Function Frequency Domain State Space Characterisation Time Differential Equations Linearise mV
Cross Spectral Density • Transfer Function and Convolution Kernels • First Order Volterra Series Expansion: Exact Linear Impulse Response c1 c2 c3 output s2(t) output s3(t) output s1(t) u1 • By Definition, the Cross Spectral Density is given by
Overview • Data Features • The Generative Model in DCMs for Steady-State Responses - a family of neural mass model • Bayesian Inversion: Parameter Estimates and Model Comparison • Example. DCM for Steady State Responses: • Glutamate with Microdialysis validation • Predicting Anaesthetic Depth
Power Frequency (Hz) + Freq Domain Output c3 c2 c1 Time Domain Freq Domain NMM NMM NMM Freq Domain Cortical Input Bayesian Inversion Model Evidence Approximate Posterior
Inversion Neural Parameters Define likelihood model Observer function Specify priors Inference on models Invert model Inference on parameters Make inferences
Overview • Data Features • The Generative Model in DCMs for Steady-State Responses - a family of neural mass model • Bayesian Inversion: Parameter Estimates and Model Comparison • Example. DCM for Steady State Responses: • Glutamate with Microdialysis validation • Predicting Anaesthetic Depth
Glutamate & microdialysis Schizophrenic: Rearing Models Controls Controls mPFC N=7 mPFC Isolated Isolated mPFC N=8 mPFC Regular Glutamate Regular Glutamate Low Glutamate Low Glutamate mPFC EEG 0.12 0.12 0.06 0.06 0 0 mV mV - - 0.06 0.06 mPFC
Hypotheses • Main findings from microdialysis: • reduction in prefrontal glutamate levels of isolated group→ sensitization of post-synaptic mechanisms (e.g. upregulation) • Model parameters should reflect • amplitude of synaptic kernels • coupling parameters of glutamatergic connections • neuronal adaptation (i.e., 2)
g g 5 5 g g g 4 4 3 g g 1 2 sensitization of post-synapticmechanisms Results Intrinsic Intrinsic connections Inhibitory cells in supragranular layers [3.8,6.3] (0.04) [29,37] (0.4) [4.6,3.9] (0.17) Extrinsic Extrinsic Excitatory spiny cells in granular layers forward forward Excitatory spiny cells in granular layers connections connections u u [195, 233] [161,210] (0. 13) (0.37) Excitatory pyramidal cells in infragranular layers Excitatory pyramidal cells in infragranular layers Control group estimates in blue Isolated animals in red with p values in parentheses. [0.76,1.34] (0.0003) Increased neuronal adaption: decrease firing rate In our simulation excitatory parameters were inferred with inhibitory connectivity (and impulse response) prior parameter variances set to zero. Two-tailed paired t-test Moran et al., NeuroImage, 2007
Overview • Data Features • The Generative Model in DCMs for Steady-State Responses - a family of neural mass model • Bayesian Inversion: Parameter Estimates and Model Comparison • Example. DCM for Steady State Responses: • Glutamate with Microdialysis validation • Predicting Anaesthetic Depth
Case Study: Depth of Anaesthesia A1 A2 LFP 0.12 0.12 Trials: 1: 1.4 Mg Isoflourane 2: 1.8 Mg Isoflourane 3: 2.4 Mg Isoflourane 4: 2.8 Mg Isoflourane (1 per condition) 0.06 0.06 0 0 mV mV - - 0.06 0.06 30sec 0.12 0.12 0.06 0.06 0 0 mV mV - - 0.06 0.06
Models FB Model (1) A1 Forward (Excitatory Connection) F Model (2) A1 Forward (Excitatory Connection) A2 Forward (Excitatory Connection) A2 Backward (Inhibitory Connection) L Model (3) Lateral (Mixed Connection) A1 A2 Lateral (Mixed Connection)
A1 to A2: Excitatory 100 Results 80 FB Model (1) 60 A1 strength (%) Forward 40 20 0 1 2 3 4 trial A2 A2 to A1: Modulatory 300 Backward 250 200 strength (%) 150 100 50 0 1 2 3 4 trial
Newer theory focused on pathological synchrony: STN Beta oscillations correlate to disease state 20 Hz Pathological Beta Rhythms in Parkinson’s Chronic loss Dopamine innervations in the Striatum Traditional theory of negative motor symptoms induced by an unbalance in the striatal outputs of direct ( ) /indirect ( ) pathways
D D D D Ctx Str GPe STN Neuronal states: LFP model subsets GPi Th GABA Glut Pathological Beta Rhythms
Pathological Beta Rhythms Ctx Str Effects of Chronic Dopamine Loss GPe STN GPi Th Control PD 0.9 1.6 0.8 1.4 0.7 1.2 0.6 1 0.5 0.8 0.4 0.6 0.3 0.4 0.2 0.2 0.1 0 0 Str to GPe GPe to STN
Summary • DCM is a generic framework for asking mechanistic questions of neuroimaging data • Neural mass models parameterise intrinsic and extrinsic ensemble connections and synaptic measures • DCM for SSR is a compact characterisation of multi- channel LFP or EEG data in the Frequency Domain • Bayesian inversion provides parameter estimates and allows model comparison for competing hypothesised architectures • Empirical results suggest valid physiological predictions