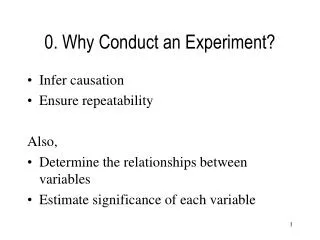
Download

1 / 54
560 likes | 878 Vues
Empirical Research in HCI: What? Why? How?. I. Scott MacKenzie. Part I – The Short Answer. What?. Empirical research is… observation-based investigation seeking to discover and interpret facts, theories, or laws. Why?. Two answers… First, we conduct empirical research to…

E N D
Empirical Research in HCI:What? Why? How? I. Scott MacKenzie
What? • Empirical research is… • observation-based investigation seeking to discover and interpret facts, theories, or laws.
Why? • Two answers… • First, we conduct empirical research to… • answer (or raise!) questions about a new or existing UI design or interaction method. • Second… (we’ll get to this later)
How? • We conduct empirical research through… • a program of inquiry conforming to “the scientific method”.
Three Themes • Answer and raise questions • Observe and measure • User studies
Observe and Measure • Observations are gathered… • Manually (human observers) • Automatically (computers, software, sensors, etc.) • A measurement is a recorded observation When you cannot measure, your knowledge is of a meager and unsatisfactory kind. Kelvin, 1883
crude sophisticated Use ratio measurements where possible Scales of Measurement • Nominal • Ordinal • Interval • Ratio Nominal – arbitrary assignment of a code to an attribute, e.g., 1 = male, 2 = female Ordinal – rank, e.g., 1st, 2nd, 3rd, … Interval – equal distance between units, but no absolute zero point, e.g., 20° C, 30° C, 40° C, … Ratio – absolute zero point, therefore ratios are meaningful, e.g., 20 wpm, 40 wpm, 60 wpm
Ratio Measurements • Preferred scale of measurement • With ratio measurements summaries and comparisons are strengthened • Report “counts” as ratios where possible • Example – a 10-word phrase was entered in 30 seconds • Bad: t = 30 seconds • Good: Entry rate = 10 / 0.5 = 20 wpm • Example – two errors were committed while entering a 10-word (50 character) phrase • Bad: n = 2 errors were comitted • Good: Error rate was 2 / 50 = 0.04 = 4%
Research Questions • Why do we conduct empirical research? • Simply… • To answer (or raise!) questions about a new or existing UI design or interaction technique! • Questions include… • Is it viable? • Is it as good as or better than current practice? • Which of several design alternatives is best? • What are its performance limits and capabilities? • What are its strengths and weaknesses? • Does it work well for novices, for experts? • How much practice is required to become proficient?
Scenario… You have invented a new text entry technique for mobile phones. In your view, it’s pretty good. In fact, you think it’s better than the most widely used current technique, multi-tap. You decide to undertake some empirical research to evaluate your invention and to compare it with multi-tap? What are your research questions? Testable Research Questions • Preceding questions, while unquestionably relevant, are not testable • Try to re-cast as testable questions (…even though the new question may appear less important)
Research Questions (2) • Weak question… • Is the new technique better than multi-tap? • Better… • Is the new technique faster than multi-tap? • Better still… • Is the new technique faster than multi-tap within one hour of use? • Even better… • If error rates are kept under 2%, is the new technique faster than multi-tap within one hour of use?
Internal validity External validity A Tradeoff If error rates are kept under 2%, is the new technique faster than multi-tap within one hour of use? High Low Accuracy of Answer Is the new technique better than multi-tap? Narrow Broad Breadth of Question
Internal Validity • The extent to which the effects observed are due to the test conditions • Statistically… • Differences in the means are due to inherent properties of the test conditions • Variances are due to participant differences (‘pre-dispositions’) • Other potential sources of variance are controlled (‘nulled’) • Note: Uncontrolled sources of variance are bad news and compromise internal validity
External Validity • The extent to which results are generalizable to other people and other situations • Statistically… • Re people, the participants are representative of the broader intended population of users • Re situations, Test environment and experimental procedures are representative of real world situations where the UI/technique will be used
Test Environment Example • Scenario… • You wish to compare two input devices for remote pointing (e.g., at a projection screen) • External validity is improved if the test environment mimics expected usage • Test environment should probably… • Use a projection screen (not a CRT) • Position participants at a significant distance from screen (rather than close up) • Have participants stand (rather than sit) • Include an audience! • But… is internal validity compromised?
Experimental Procedure Example • Scenario… • You wish to compare two text entry techniques for mobile devices • External validity is improved if the experimental procedure mimics expected usage • Test procedure should probably require participants to… • Enter representative samples of text (e.g., phrases containing letters, numbers, punctuation, etc.) • Edit and correct mistakes as they would normally • But… is internal validity compromised?
The Tradeoff • There is tension between internal and external validity • The more the test environment and experimental procedures are “relaxed” (to mimic real-world situations), the more the experiment is susceptible to uncontrolled sources of variation, such as pondering, distractions, or secondary tasks Internalvalidity Externalvalidity
Strive for the Best of Both Worlds • Internal and external validity are increased by… • Posing multiple narrow (testable) questions that cover the range of outcomes influencing the broader (untestable) questions • E.g., a technique that is faster, is more accurate, takesfewer steps, is easy to learn, and is easy to remember, is generally better • The good news • There is usually a positive correlation between the testable and untestable questions • I.e., participants generally find a UI better if it is faster, more accurate, takes fewer steps, etc.
The Siren Call of the Skeptic • There’s a gotcha in the previous slide • The “good news” means we don’t need empirical research • We just do a user study and ask participants which technique they preferred • Because of the “positive correlation”, we needn’t waste our time on all this gobbly-gook data collection and analysis
Better1 vs Better2 • A few points… • If participants are asked which technique they prefer, they’ll probably give an answer… even if they really have no particular preference! (There are many reasons, such as how recently they were tested on a technique, personal interaction with the experimenter, etc.) • How much better? (A new technique might be deemed worthwhile only if the performance improvement is greater than, say, 20%.) • What are the strengths, weaknesses, limits, capabilities of the technique? (Are there opportunities to improve the technique?) • We need measurements to answer these questions! 1 Aggregate outcome of answers to narrow (testable) empirical questions 2 Answer to broad (untestable) question
Answering Empirical Questions • We want to know if the measured performance on a dependent variable (e.g., speed) is different between test conditions, so… • We conduct a user study and measure the performance on each test condition over a group of participants • For each test condition we compute the mean score over the group of participants • Then what? Next slide
Answering Empirical Questions (2) • Three questions: • Is there a difference? • Is the difference large or small? • Is the difference significant or is it due to chance? • Question #1 – obvious (some difference is likely) • Question #2 – statistics can’t help (Is a difference of 5% large or small?) • Question #3 – statistics can help • The basic statistical tool for Question #3 is the analysis of variance (anova)
Analysis of Variance • It is interesting that the test is called an analysis of variance, yet it is used to determine if there is a significant difference between the means. • How is this?
Example #1 Example #2 Difference is significant Difference is not significant “Significant” implies that in all likelihood the difference observed is due to the test conditions (Method A vs. Method B). “Not significant” implies that the difference observed is likely due to chance.
Example #1 - Details Error bars show ±1 standard deviation Note: SD is the square root of the variance
Probability that the difference in the means is due to chance • Thresholds for “p” • .05 • .01 • .005 • .001 • .0005 • .0001 Example #1 - Anova Reported as… F1,9 = 8.443, p < .05
Example #2 - Details Error bars show ±1 standard deviation
Probability that the difference in the means is due to chance Note: For non- significant effects, use “ns” if F < 1.0, or “p > .05” if F > 1.0. Example #2 – Anova Reported as… F1,9 = 0.634, ns
Hypothesis = research question Phenomenon = an interaction between a human and a computer (technology) Very nice, but what to researchers actually do? Other interactions next slide Experiment = user study Predict = predictive model Describe = descriptive model Scientific Method (classical view) • Four steps… • Observe and describe a phenomenon • Formulate an hypothesis to explain it • Use the hypothesis to predict or describeother phenomena • Perform experiment to test hypothesis
Steps 1-3 (previous slide) Short paper, Poster, Abstract Iterations are frequent, unstructured, intuitive, informed, … Steps in Empirical Research Phase I – The Prototype Analyse,Model Build Prototype Test,Measure,Compare Research questions “take shape” (I.e., certain measurable aspects of the interaction suggest “test conditions”, and “tasks” for empirical inquiry.
Steps in Empirical Research (2) Phase II – The User Study Build Apparatus(integrate prototype and test conditions into experimental apparatus & software) Design Experiment(tweak software, establish experimental procedure & design, run pilot subjects) User Study (collect data, conduct interviews) Analyse Data(build models, check for significant differences, etc.) Publish Results Next iteration
Data Collection and Progression Computed after experiment Collected during experiment RawData AnovaTable RawData AnovaTable RawData SummaryData AnovaTable RawData Filter Filter AnovaTable RawData RawData
Raw Data • Vertical format, unstructured, ugly! • Primarily contains timestamps and events • Also identifies test conditions, participant, session, etc., either in filename or within file (needed later) • Advice: plan ahead! Example
Summary Data • Rectangular • One row per “unit of analysis” • Formatted for importing into spreadsheet • Columns for test conditions (largely redundant, but useful), and dependent measures (aggregated as per the “unit of analysis”) Example
Anova Table • Rectangular • One row per participant • Formatted for importing into stats package • Cells contain dependent measures • One file per dependent measure Example
Case Study • Scenario… Researcher R has an interest in the application of eye tracking technology to the problem of text entry. After studying the existing body of research and commercial implementations, R develops some ideas on how to improve the interaction. R initiates a program of empirical inquiry to explore the performance limits and capabilities of various feedback modalities for keys in on-screen keyboards used with eye typing. Reality check
Short paper, poster, abstract Case Study (reality check) Phase I – The Prototype A Priori Analyses Build Prototype Test,Measure,Compare
The User Study (1) • Participants • 13, volunteer, recruited from university campus, age, gender, computer experience, eye tracking/typing experience • Apparatus • Describe hardware and software, etc.
The User Study (2) • Experiment design • 4 x 4 repeated measures design • Controlled variables (viz. factors)… • Feedback modality (A0, CV, SV, VO) • Block (1, 2, 3, 4) • Dependent variables (viz. measures) • Speed (in “words per minutes”) • Accuracy (in “percentage of characters in error”) • Key activity (in “keystrokes per character”) • Eye activity (in “read presented text events per phrase”) • Etc. (other “events” of interest) • Also… responses to “broad” questions • Order of conditions • Feedback modality order differed for each participant
The User Study (3) • Procedure • General objectives of experiment explained • Eye tracking apparatus calibrated • Practice trials, then • Data collection begins • Phrases of text presented by experimental software • Participants instructed to enter phrases “as quickly and accurately as possible” • Five phrases entered per block • Total number of phrases entered in experiment… • 13 x 4 x 4 x 5 = 1040
User Study (4) • Raw data (208 files) • Summary data (1 file) • Anova Tables (~5 files) Raw data file - example Summary data file Anova table (speed)
The User Study (5) • Results for speed (only example given here) • Grand mean = 6.96 wpm • By feedback modality… • By block… • Salient observations • 4th block speed for best condition was…
Factors and levels Outlier (explain in paper) Each cell is the mean for five phrases of input Anova Data Table(not in paper)
Anova Table(not in paper) • Verbal statement and discussion of findings will include… • Main effect for Feedback mode significant: F3,36 = 8.77, p < .0005 • Main effect for Block significant: F3,36 = 10.92, p < .0001 • Feedback mode by block interaction not significant: F9,108 = 0.767, ns
5.7% faster on 4th block Summary Table for Speed(not in paper)
The Broad Questions • Participants were asked to rank the feedback mode based on personal preference • Results • Six of 13 participants gave a 1st place ranking to the fastest feedback modality • Not a strong result • Probably the differences just weren't large enough for participants to really tell the difference in overall performance. • Notably, ten of 13 participants gave a 1st or 2nd place ranking to the fastest feedback modality • Thus, there is a modest trend that better performance yields a better preference rating (but empirical research is the key!)
Case Study (reality check) Phase II – The User Study Build Apparatus(integrate prototype and test conditions into experimental apparatus & software) Design Experiment(tweak software, establish experimental procedure & design, run pilot subjects) User Study (collect data, conduct interviews) Analyse Data(build models, check for significant differences, etc.) Publish Results Next iteration