Methods for Dummies 2007
Methods for Dummies 2007. Overview. Practical info Topics to be covered in MfD 2007 How to prepare your presentation Where to find information and help Methods Group Experts Introduction for dummies. Areas Covered in MfD. Basic Statistics fMRI EEG / MEG Connectivity

Methods for Dummies 2007
E N D
Presentation Transcript
Overview • Practical info • Topics to be covered in MfD 2007 • How to prepare your presentation • Where to find information and help • Methods Group Experts • Introduction for dummies
Areas Covered in MfD • Basic Statistics • fMRI • EEG / MEG • Connectivity • Some other topics
Basic Statistics 26th Sept – 31st Oct • Linear Algebra & Matrices (Verity Leeson, Steve Fleming) • T-tests, ANOVA’s & Regression (Ellen Meierotto, Tom Jenkins) • General Linear Model (Marijn Kroes, Marsha Quallo) • Bayes for beginners (Robert Adam, Caroline Catmur)
fMRI7th Nov – 23rd Jan • What are we measuring – basis of BOLD (Marieke Scholvinck) • Realigning and un-warping (Petra Swingenschuh, Antoinette Nicolle) • Co-registration & spatial normalisation (Eddy Davelaar, Naz Derakhshan) • Study design and efficiency (Tali Sharot, Christian Kaul) • 1st level analysis (Cat Sebastian & Nathalie Fontaine) • Temporal basis functions and correlated regressors (Elvina Chu, Joseph Devlin) • Buttons in SPM (Alice Jones, Sean O‘Sullivan) • 2nd level analysis – design matrix, contrasts and inference (Sarah White, Deborah Talmi) • Random field theory (Bahador Bahrami, Mkael Symmonds)
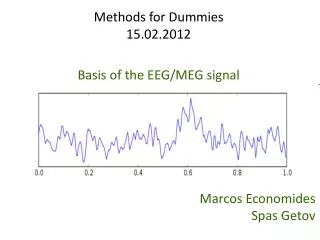
EEG & MEG30 Jan – 20th Feb • What does EEG / MEG measure? (Nathasha Kirkham, Matthew Longo) • Pre-processing for EEG & MEG (Kathrin Cohen-Kadosh, Przemek Tomalski) • Experimental design for EEG -Contrasts and Inferences (Joe Brooks, Rachel Wu) • Source localisation for EEG & MEG (Stavroula Kousta, Martin Chadwick)
Connectivity27th Feb – 26th March • Intro to connectivity PPI & SEM (Stephanie Burnett, Roland Benoit) • DCM for fMRI – theory (Tobias Grossmann, Christos Pliatsikas) • DCM for fMRI – practice (Vladimir Litvak, Valentina Doria) • DCM for ERP / ERF – theory (David Pitcher, Georg Kaegi) • DCM for induced responses (CC Chen, Anne Richards)
Other topics2nd April & 16th April • Multivariate techniques and Bayesian decoding (Oliver Hulme, Fani Deligianni) • Retinotopy / phase mapping (Lauri Jalkanen, Carlton Chu) • Voxel Based Morphometry (Marianne Novak, Nicola Hobbs)
What if I can’t make my presentation? • If you want to change / swap your topic, try and find someone else to swap with…. • …if you still can’t find a solution, then get in touch with Justin or Hanneke.
How to prepare your presentation • Remember your audience are not experts… • 20 minutes each + questions • Two presenters per session • The aim of the sessions is to • introduce the concepts and explain why they are important to imaging analysis • familiarise people with the basic theory and standard methods
Where to find help • Key papers • Last year’s slides http://www.fil.ion.ucl.ac.uk/~mgray/ • Human Brain Function Textbook (online) • Methods Group Experts • Cambridge CBU homepage (Rik Henson’s slides) http://www.mrc-cbu.cam.ac.uk/Imaging/Common/http://www.mrc-cbu.cam.ac.uk/Imaging/Common/spm-minicourse.shtml • Monday Methods Meetings (4th floor FIL) • SPM email List
Methods Group Experts • Will Penny • John Ashburner • Stephan Kiebel • Guillaume Flandin • James Kilner • Klaas Enno Stephan • Carlton Chu • Andre Marreiros • Justin Chumbley • Vladimir Litvak
Outline • Getting started with an experiment • Things you need to know for scanning • SPM & your (fMRI) data • Preprocessing • Analysis • Connectivity • Other types of analysis • Acronyms
Getting started – Cogent scripts • Allow you to present scanner-synchronized visual stimuli, auditory stimuli, mechanical stimuli, and taste and smell stimuli. Details at: http://www.vislab.ucl.ac.uk/Cogent/ • Used to monitor key presses and other physiological recordings from the subject, as well as logging stimulus and scan onset times. • Try and get hold of one to modify rather than starting from scratch! People are more than happy to share scripts around… • If you need help, talk to Eric Featherstone… • …and if you need to use any special equipment then Peter Aston is the man to see
Getting started - scanning decisions to be made • What are your scanning parameters: • how many conditions/sessions/blocks • what ISI do you want • what sequence do you use • at what angle • how much brain coverage do you need • how many slices • what slice thickness • what TR do you use (DCM?)
Summary for scanning • Get you script ready & working with the scanner • Make sure it logs all the data you need for your analysis • Back up your data from the stimulus PC! You can transfer it via the network after each scanning session… • Provide the radiographers with tea, biscuits, chocolate etc.
Hurrah! I have brain data! • SO WHAT DO I DO WITH IT NOW? • This is where we get into SPM & preprocessing… • …and more decision-making! • It can take a long time to process at this stage, so make sure you have decided in advance!
Statistical Parametric Mapping • MfD 2007 will focus on the use of SPM5 • SPM software has been designed for the analysis of brain imaging data in fMRI, PET, SPECT, EEG & MEG • It runs in Matlab…just type SPM at the prompt and all will be revealed. • There are sample data sets available on the SPM website to play with
Preprocessing Possibilities… • These steps basically get your imaging data to a state where you can start your analysis • Realignment & Unwarping • Normalisation • Smoothing
Analysis • Once you have carried out your pre-processing you can specify your design and data • The design matrix is simply a mathematical description of your experiment E.g. ‘visual stimulus on = 1’ ‘visual stimulus off = 0’
Analysis • Once you have carried out your pre-processing you can specify your design and data • The design matrix is simply a mathematical description of your experiment • E.g. ‘visual stimulus on = 1’ ‘visual stimulus off = 0’ • Our fMRI data is a time series based on the haemodynamic response. The basis functions used in SPM are curves used to ‘describe’ or fit the haemodynamic response in relation to our model
Analysis • Once you have carried out your pre-processing you can specify your design and data • The design matrix is simply a mathematical description of your experiment • E.g. ‘visual stimulus on = 1’ ‘visual stimulus off = 0’ • Our fMRI data is a time series based on the haemodynamic response. The basis functions used in SPM are curves used to ‘describe’ or fit the haemodynamic response in relation to our model • The HRF is convolved with the design matrix, and we estimate how much variance of the BOLD response our convolved parameters can explain for each voxel, which is expressed in an SPM
Contrasts & inference • The SPMs are then thresholded to correct for multiple comparisons • Contrasts allow us to test hypotheses about our data, using t & f tests • 1st level analysis: activation over scans (within subject) • 2nd level analysis: activation over subjects
Connectivity • Functional segregation – responses to an input giving a regionally specific effect • Functional integration – how one region influences another…subdivided into: • Functional connectivity: correlations among brain systems (e.g. principal component analysis) • Effective connectivity: the influence of one region over another (e.g. psycho-physiological interactions, or DCM)
Other techniques • Voxel-Based Morphometry • Contrasts differences in structural data on a voxel-by-voxel basis • Used to compare size or shape of brain region, for instance • Comparing brain-damaged patients with a control group • mapping changes in grey (or white) matter within subjects over time • Multivariate techniques • Data-classifier technique • E.g. to investigate whether certain information is represented in particular areas of the brain. • Retinotopy • Spatially maps visual information from a specific location in the retina to a specific location in the cortex.
Acronyms • SPM – statistical parametric mapping • SnPM – statistical non-parametric mapping • DCM – dynamic causal model • PPI – psychophysiological interaction • VBM – voxel-based morphometry • ROI – region of interest • ReML – restricted maximum likelihood • HRF – haemodynamic response function • GLM – general linear model • RFT– random field theory • (also GRF – gaussian) • SOA – stimulus onset asynchrony • ISI – interstimulus interval • PCA – principal component analysis • ICA – independent component analysis • FFX – fixed effects analysis • RFX – random effects analysis • PEB – parametric empirical bayes • FWE – family wise error • FDR – false discovery rate • FWHM – full width half maximum • PPM – posterior probability map • FIR – finite impulse response