Download
1 / 14
140 likes | 321 Vues
The perils and pitfalls of productivity measurement for English local authorities. This work is funded by the ESRC Public Services Programme, grant no. RES-153-25-00 60. Prof Iain McLean Dr Dirk Haubrich University of Oxford. Outline of talk. Productivity in the context of our project

E N D
The perils and pitfalls of productivity measurementfor English local authorities This work is funded by the ESRC Public Services Programme, grant no. RES-153-25-00 60 Prof Iain McLean Dr Dirk Haubrich University of Oxford
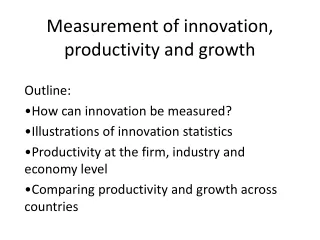
Outline of talk • Productivity in the context of our project • The CPA framework to assess English local authorities • Pitfall 1: Vicious triangles • Pitfall 2: The limits of self-assessment • Pitfall 3: Inferring productivity from authorities’ expenditure & CPA scores
Productivity in the context of our project Productivity is only one of many issues addressed by our 12-months research project, which asks 3 questions about the assessment of local authorities: • Is CPA a reliable and valid measure to assess service quality in local authorities? Or is service quality influenced by external constraints, such as deprivation, discretionary expenditure, or political control? • Assuming that CPA is (or can be made to be) a reliable & valid measure, can it be used to capture productivity? • What, if anything, can England learn from Wales and Scotland?
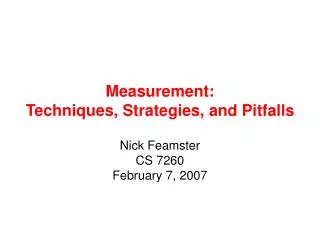
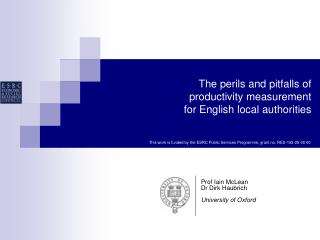
ABILITY TO IMPROVE Self-Assessment and Corporate Assessment OVERALL ASSESSMENT - Excellent - Good - Fair - Weak - Poor PUBLICREPORTING IMPROVEMENTPLANNING Benefits Social Care Environment Libraries & Leisure Use of resources Education Housing CURRENT PERFORMANCE ON SERVICES Inspection Judgements, auditor judgements,performance indicators, and governmental Assessments of councils’ plans The CPA Assessment Framework* * as applied between 2002 and 2004; minor changes introduced in 2005. ASSESSMENTFRAMEWORK ► With such an elaborate scheme (using hundreds of PIs and auditor/inspectorate judgements), CPA may be said to present a rounded assessment of an authority’s performance, potentially providing a basis for productivity measurement. Audit Commission 2002
IMD/SSA CPA CPA score increases ► greater SSA autonomy IMD ranking decreases ►SSA grant decreases Pitfall 1 – The vicious triangle (I) Indicator used in CPA and IMD/SSA: “% of pupils doing well in external assessment“ Performance on Indicator increases
Pitfall 1 – The vicious triangle (II) • Implication for local authorities:If you improve your GCSE results, your CPA score goes up but your SSA share goes down. Conversely, if GCSE results worsen, SSA share goes up but your CPA score goes down. Either way you gain a (partly) financial bonus and suffer a (partly) financial penalty. You should do whichever carries the larger net bonus. • Implication for central governmentThere are two contradictory regimes in place, at least one of which must be abandoned or modified.
Pitfall 2 – The limits of self-assessment (I) The CPA approach relies on authorities self-assessing their ability to improve service delivery in the future. Yet, the first three CPA rounds show that their self-assessment in year t is a bad predictor for their actual performance in t+1 or t+2.
Pitfall 2 – The limits of self-assessment (II) • CPA ratings and scores provide policy makers with information about an authority’s performance in delivering public services. • These might constitute a suitable output/outcome basis for productivity measurements, but the partial reliance on self-assessment to produce these scores and ratings raises doubts about their reliability and validity. • This is a problem, because the Audit Commission is currently in the process of re-designing CPA for the rounds 2008 onwards and seeks, with support from the Local Government Association (LGA), to incorporate additional elements of self-assessment. • Our analysis holds even when issues regarding ‘ceilings’ and ‘moving of the goal posts’ are considered and the model is rerun.
LAs with high productivity? Y Z X 3 Outliers LAs with low productivity? Pitfall 3 – Inferring productivity from CPA & spend (I)
Pitfall 3 – Inferring productivity from CPA & spend (II) • With such an elaborate scheme (which uses hundreds of PIs and auditor/inspectorate judgements), CPA may be said to present a rounded assessment of an authority’s performance. • Potentially, then, CPA provides a suitable basis for productivity measurement and allows identifying productive (green) and unproductive (red) authorities. • However, this is only true • if CPA is a valid and reliable measure of public service in local authorities (for doubts, see pitfalls 1 and 2) • if the formula by which central government calculates the SSA/FSS accurately assesses needs and (!) resources (see pitfall 3) • But what if not?
Circularity between CPA & IMD: Preliminary Findings • In the statistical model, the 100+ PIs used in the seven CPA service blocks (as dependent variable) need to be checked for potential circularity with the 27 indicators used in the IMD domains (as explanatory variable). • So far, no circularity issue was found for Culture, Environment, & Benefits. Education is still being checked; Social Serv. & Housing has 4 PIs with moderate/low circularity:
ABILITY TO IMPROVE Self-Assessment and Corporate Assessment The CPA AssessmentFramework OVERALL ASSESSMENT - Excellent - Good - Fair - Weak - Poor PUBLICREPORTING IMPROVEMENTPLANNING ASSESSMENTFRAMEWORK Benefits Social Care Environment Libraries & Leisure Use of resources Education Housing CURRENT PERFORMANCE ON SERVICES Inspection Judgements, auditor judgements,performance indicators, and governmental Assessments of councils’ plans Audit Commission 2002 The CPA Assessment Framework