Autonomous Soaring
Autonomous Soaring. Michael J. Allen NASA Dryden Flight Research Center SAE Guidance & Control Subcommittee Oct 20, 2005, Hilton Head, SC. Outline. Background Soaring UAV simulation study. Flight test overview and results. Future plans. Background.

Autonomous Soaring
E N D
Presentation Transcript
Autonomous Soaring Michael J. Allen NASA Dryden Flight Research Center SAE Guidance & Control Subcommittee Oct 20, 2005, Hilton Head, SC
Outline • Background • Soaring UAV simulation study. • Flight test overview and results. • Future plans.
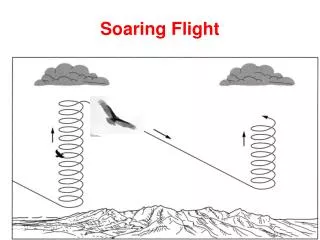
Background • Soaring is used by all large diurnal birds. • Buzzards, Hawks, Ravens, Eagles, Condors, Albatrosses, Cranes, Swifts, Pelicans, Herons, etc. • Soaring is used by glider pilots to fly as far as to 2000km (1,240mi) and climb as high as 14,900m (48,880ft). • John Wharington first proposed autonomous soaring for UAVs in 1998. • Recursive learning was used to center updrafts. Neural networks were used to identify updraft positions. • Algorithms were too intensive for real-time use. • Very simple updraft model was used
Background • Alan Cocconi flew the Solong UAV for 48hr using solar energy on June 1-3, 2005 • Span = 15.6ft • Weight = 28.2lb • One conclusion was that “the energy budget requires riding thermals.” • Cocconi also stated that the pilots/UAV operators were exhausted after 48hr of flying. • Moving map display with aircraft path was used by the pilots to soar in thermals. Path color indicates rate of change of total energy.
Soaring UAV Simulation Study, Purpose • Small, electric UAVs usually have an endurance of 45min to 2hr. • The potential benefit of autonomous soaring in thermals was studied for a small UAV.
Soaring UAV Simulation Study, Approach • Calculate convective layer scaling parameters, w* & zi, for each day during 2002 using measured surface and balloon data taken at Desert Rock, NV. • Calculate updraft velocity, radius, spacing, height and shape. • Simulate UAV flight path in updraft field.
Soaring UAV Simulation Study, Mission • Loiter-only mission was used in this study. • Travel to and from target area was not simulated. • UAV must remain line-of-sight to the target area. • Upper altitude restrictions were applied during sensitivity study.
Soaring UAV Simulation Study, Input data • Surface radiation and balloon data was used to predict thermal properties every 3 minutes during 2002. • Location: Desert Rock, NV • Ground Instrumentation: • Radiometer platform • Meteorology tower • Total Sky Imager (TSI) • Solar tracker • Sampled every 3min • Rawinsonde balloons • Launched every 12hr • Pressure, Alt, temp, dew pt., wind
Soaring UAV Simulation Study, Search Path • Updraft detection sensors were not used. • Updrafts were only detected in this study after the UAV had physically encountered them. • Archimedes spiral pattern was chosen for the UAV to fly while searching for updrafts.
Soaring UAV Simulation Study, Climb Performance • Aircraft is assumed to circle in updraft at r=80% of the updraft radius. • Flight path lateral acceleration and bank angle were used to determine sink rate performance. • Maximum bank angle was 39 deg for all simulation runs. Φ Ay
Soaring UAV Simulation Study, Flight Path Visualization • Day 220 = August 8 • Chosen because it shows all flight modes well. • Strong lift conditions. • Peak ground temperature = 97deg
Soaring UAV Simulation Study, Typical Height Time-Histories • Winter altitude gain is reduced. Winter days are shorter. • Summer altitude gain can exceed 2500m (8200ft). • Maximum endurance was found to be greater than 14 hours.
Soaring UAV Simulation Study, Performance • Nominal endurance = 2 hours • Maximum summer endurance exceeds 14 hours • Maximum winter endurance exceeds 7 hours. • Average endurance is 8.6 hours when the UAV is launched at 30% daylight hours each day.
Soaring UAV Simulation Study, Performance • Early launch times risk depleting battery before updrafts begin in the morning. • Best overall performance and probability of catching updrafts is obtained with launch times of 30% daylight hours.
Soaring UAV Simulation Study, Sensitivity Study • Simulation results remain in-sensitive to many key parameters. • Highest sensitivity is with sink velocity. 30% variation causes 8% change in endurance.
Soaring UAV Simulation Study, Sensitivity Study • Simulation results show that a small UAV can benefit significantly by exploiting updrafts. • Simulation study assumed that a small UAV could autonomously detect and center updrafts. • Is this assumption valid? • What sensors are required for soaring? • What systems are required for soaring? • Can autonomous soaring be demonstrated?
Test Hardware • CloudSwift Aircraft • Span: 4.26m (14ft) • Weight: 6.58kg (14.5lb) • Stall speed: 18kt • Mission speed: 25kt • Piccolo Autopilot • Weight: 212g (7.5 oz) • Sensors: • Rate gyros • Accelerations • Static & total pressure • GPS position & velocity • Custom software developed for this project
North-base runway Hwg-58 UAV area Operational Boundary, blue FTS deployed Range, black DFRC Flight Test Plan • Phase-1: Aircraft and Piccolo Checkout Flights • Phase-2: Soaring research flights • Up to 4,000ft AGL • Conducted on the edge of Rogers Dry Lakebed
Flight Test,Guidance and Control for Thermal Soaring Static Pressure Total Energy Estimation Ë TAS Mode Switching Turn Rate Command Ė Throttle Updraft radius Soaring Turn Rate Command Position Error Strength Updraft Identification Circle Guidance Controller Latitude Velocity Error Position Longitude Circle Turn Rate Waypoint Tracking Turn rate command
Flight Test,Simulation Prediction • Hardware in the loop simulation was used to test soaring control. • Data was replayed through the Simulink autopilot diagrams to check Piccolo internal states. • Dryden-developed updraft model was used.
Flight Test Results • 17 flights were conducted • perform aircraft checkout • autopilot gain tuning • FTS range tests • research flights • 23 updrafts were found. • Average climb for all updrafts = 172m (567ft) • Play cloudSwift_flt08_pr.mp2v
Flight Test Results Flight 12, Updraft 2 • Highest climb in a single updraft • Sept 9, 2005. • 844m (2770ft) altitude gain. • Play: cloudSwift_flt12_up2.igc 3 Manual disengage to stay within airspace 2 1 0 -1 Updraft detection, switch to soaring mode Start, waypoint navigation mode -2 -3 Climb- rate, m/s
Flight Test Results Start Updraft detection
Flight Test Results Updraft detection Disengagement
Flight Test Results Updraft detection Disengagement
Flight Test Results Updraft detection Disengagement
Flight Test Results Updraft detection Disengagement
Flight Test Results Flight 12, Updraft 5 • Example of a failure to stay in updraft. • Updraft is small and weak • Detection is not quick enough. • Play: cloudSwift_flt12_up5.igc 1 0 -1 Climb- rate, m/s
Flight Test Results Start
Flight Test Results • Flight path through two small updrafts. • Autonomous detection, climb, and exit is shown. • Play: cloudSwift_flt11_up3n4.igc 1 2nd updraft 1st updraft 0 Start -1 Climb- rate, m/s
Flight Test Results 2nd updraft Start 1st updraft
Future Plans • Complete data reduction and document soaring controller and results. • Refine updraft detection algorithms. • Investigate speed to fly theory for UAVs. • Investigate other ways to soar • Cooperative thermal soaring • Ridge soaring • Low-altitude dynamic soaring (Albatross) • Dynamic soaring in thermals • Soaring for planetary aircraft
Background, Dynamic Soaring • Joe Wurts discovered that he could maintain closed-circuit dynamic soaring with an RC glider at Parker Mt, near Acton, CA. • Sandia National Laboratories instrumented an RC glider and did dynamic soaring research at Parker Mt. • Developed tools needed to optimize bird-like behavior. • Concluded that autonomous dynamic soaring is possible. • James Parle presented similar flight results in addition to a measured wind profile at SHA in 2003 • Many papers written on dynamic soaring theory and optimal paths for dynamic soaring • Lord Reyleigh, 1883 • J.A. Wilson • Taras Kicnuik • Sachs • Zhao • Beeler, Moerder, and Cox • Peter Lissaman
Background, Regenerative Soaring • Paul MacCready published “Regenerative Battery-Augmented Soaring” in 1998 • Propeller used as wind turbine to recharge batteries during descent. • Concluded that “A radio-controlled model airplane, with GPS navigation and a windmill charging system, could make an autonomous, long duration flight on a mountain slope in continuous wind conditions.”
Updraft Model • Input data taken from Desert Rock, NV surface radiation station. • Heat budget was used to calculate updraft velocity. • Updraft spacing and size was calculated from convective scale parameters. • Updraft shape was taken from Konovalov’s paper.