Thermal Soaring Forecasting
Thermal Soaring Forecasting. Michael F. Stringfellow. Introduction. Thermals Columns of warm air that rise from the ground when heated by the sun Soaring Sustained engineless flight using natural sources of lift. Definitions. Boundary or mixing layer

Thermal Soaring Forecasting
E N D
Presentation Transcript
Thermal Soaring Forecasting Michael F. Stringfellow
Introduction • Thermals • Columns of warm air that rise from the ground when heated by the sun • Soaring • Sustained engineless flight using natural sources of lift
Definitions • Boundary or mixing layer • The zone of the atmosphere near the ground where thermals occur • Lapse Rate • Fall of air temperature with altitude • Dew Point • Temperature at which moisture vapor in the air condenses • Skew-T Chart • Fancy diagram used by meteorologists to plot lapse rate and relative humidity
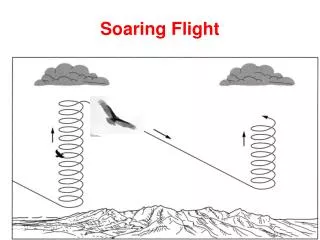
Making Thermals • Conditions for thermals • Sun heats the ground • Little cloud cover • Dry soil • Pools of warm air can form • Light winds or shelter • Thermal triggers • Mechanical disturbance (man-made or natural) • Hot air near the ground has buoyancy • Air above is lighter (cooler or drier)
Thermal Characteristics • When triggered, hot air rises • If surrounding air is lighter, thermal continues rising • Thermal stops when it reaches temperature of surroundings • Thermal strength depends on difference of temperature between it and surrounding air • Thermal Index
Thermal Forecasting • Estimate solar heating of ground • Cloud cover • Time of year/day • Estimate lapse rate and dew point of air • Actual and forecast soundings • Strength of thermals • Boundary layer depth (top of thermals)
Forecasting Tools • National Weather Service • NOAA • Dr. Jack’s Blipmaps • Soaring forecasts
Forecasts from Soundings -3 TI at 7,500 feet
How I Forecast Thermals • Check actual and forecast weather • Weather Service, Webcams • Check satellite maps • Visible, Infrared and water vapor • Check Blipmaps • Thermal strength, top-of-the lift, buoyancy/shear ratio, cumulus prediction • Check Forecast Soundings • Temperature, winds lapse rate, inversions, cloudbase, convective potential etc.
Soaring Forecast Page • Seven main sub pages for forecasting: • Current Weather • Forecast Weather • Blipmaps & Blipspots • Mike the Strike’s Forecast • Week’s Soaring Forecast • Weather Links • Webcams
Reading Blipmaps - 1 • Thermal Strength • Predicted average net thermal strength • Subtract glider minimum sink rate to estimate actual rate of climb • Remember thermals will vary from weak to strong
Reading Blipmaps - 2 • Top of the lift • Hcrit is top of the lift experienced by a glider in feet MSL • Usually at the –3 TI point on the Skew-T chart
Reading Blipmaps - 3 • Boundary Layer Depth • Height of thermals above the ground in feet • Remember you won’t usually get this high in a glider
Reading Blipmaps - 4 • Cumulus Potential • Chance of thermal-generated cumulus clouds
Reading Blipmaps - 5 • Overdevelopment Potential • Chance for showers and thunderstorms • Usually not good when too high!
Reading Blipmaps - 6 • Buoyancy/Shear Ratio • Indicates chance of thermals blowing apart in wind • Less likely with strong thermals or weak winds • >5 is usually OK • <5 thermals broken
Reading Blipspots Data for 2 PM Local
Reading Skew-T Charts Wind Speed & Direction Predicted Dew Point Temperature Predicted Air Temperature Atmospheric Pressure
Interactive Skew-T (Arizona) Convective Potential Energy Predicted Cloud Base Boundary Layer Top Predicted Parcel Motion
Interactive Skew-T (Arizona) Stable Air Top of the Lift(5,600 ft)
Interactive Skew-T (Florida) Top of Lift (28,000 feet) Unstable Air
Boundary Layer Height 2450 meters 7845 Ft
Check forecast weather Sun Cloud Winds Maximum temperature Satellite images Check Blipmaps & Blipspots Thermal strength Top of Lift Cumulus Buoyancy/Shear Check Soundings FSL Interactive NOAA Ready Check Trends High pressure building? Dry air moving in? Watch the sky Do conditions match the forecast? Check temperatures Summary