Download
1 / 17
170 likes | 298 Vues
Uncertainty and Safety Measures. How do we classify uncertainties? What are their sources? Lack of knowledge vs. variability. What type of safety measures do we take? Design, manufacturing, operations & post-mortems Living with uncertainties vs. changing them

E N D
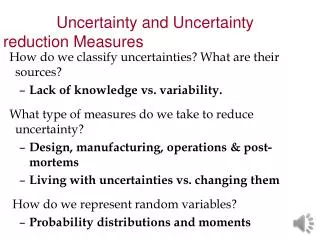
Uncertainty and Safety Measures How do we classify uncertainties? What are their sources? • Lack of knowledge vs. variability. What type of safety measures do we take? • Design, manufacturing, operations & post-mortems • Living with uncertainties vs. changing them How do we represent random variables? • Probability distributions and moments
Reading assignment S-K Choi, RV Grandhi, and RA Canfield, Reliability-based structural design, Springer 2007. Available on-line from UF library http://www.springerlink.com/content/w62672/#section=320007&page=1 Source: www.library.veryhelpful.co.uk/ Page11.htm
Classification of uncertainties Aleatory uncertainty: Inherent variability • Example: What does regular unleaded cost in Gainesville today? Epistemic uncertainty Lack of knowledge • Example: What will be the average cost of regular unleaded January 1, 2014? Distinction is not absolute Knowledge often reduces variability • Example: Gas station A averages 5 cents more than city average while Gas station B – 2 cents less. Scatter reduced when measured from station average! Source: http://www.ucan.org/News/UnionTrib/
A slightly differentuncertainty classification British Airways 737-400 . Distinction between Acknowledged and Unacknowledged errors
Error modeling • Model qualification, verification, and validation often provide estimates of the errors associated with the use of simulation. • Experience in modeling similar problems may provide additional guidance. • The most common model of the errors is simple bounds. For example . • We often settle for larger errors than possible because of computational costs or analysis complexity.
Safety measures Design: Conservative loads and material properties, building block and certification tests. Manufacture: Quality control. Operation: Licensing of operators, maintenance and inspections Post-mortem: Accident investigations
Many players reduce uncertainty in aircraft. The federal government (e.g. NASA) invests in developing more accurate models and measurement techniques. Boeing invests in higher fidelity simulations and high accuracy manufacturing and testing. Airlines invest in maintenance and inspections. FAA invests in certification of aircraft & pilots. NTSB, FAA and NASA fund accident investigations.
Representation of uncertainty Random variables: Variables that can take multiple values with probability assigned to each value Representation of random variables • Probability distribution function (PDF) • Cumulative distribution function (CDF) • Moments: Mean, variance, standard deviation, coefficient of variance (COV)
Probability density function (PDF) • If the variable is discrete, the probabilities of each value is the probability mass function. • For example, with a single die, toss, the probability of getting 6 is 1/6.If you toss a pair dice the probability of getting twelve (two sixes) is 1/36, while the probability of getting 3 is 1/18. • The PDF is for continuous variables. Its integral over a range is the probability of being in that range.
Histograms • Probability density functions have to be inferred from finite samples. First step is histogram. • Histogram divide samples to finite number of ranges and show how many samples in each range (box) • Histograms below generated from normal distribution with 50 and 500,000 samples.
Number of boxes • Standard deviation (from sample to sample) of the number n in a box is approximately . Keep that below change in n from one box to next. • Histograms below generated with 5,000 samples from normal distribution. • With 8 boxes s.d. relatively small (~20) but picture is coarse. With 20 it’s about right, with 50 s.d. is too high (~10) relative to change from one box to next.
Histograms and PDF How do you estimate the PDF from a histogram? Only need to scale.
Cumulative distribution function Integral of PDF Experimental CDF from 500 samples shown in blue, compares well to exact CDF for normal distribution.
Probability plot • A more powerful way to compare data to a possible CDF is via a probability plot
Moments • Mean • Variance • Standard deviation • Coefficient of variation • Skewness
problems • List at least six safety measures or uncertainty reduction mechanisms used to reduce highway fatalities of automobile drivers. • Give examples of aleatory and epistemic uncertainty faced by car designers who want to ensure the safety of drivers. 3. Let x be a standard normal variable N(0,1). Calculate the mean and standard deviation of sin(x) Source: Smithsonian Institution Number: 2004-57325