Download
1 / 56
560 likes | 661 Vues
Discover the GUVI (Global Ultraviolet Imager) data through visually captivating images depicting various orbits and atmospheric conditions. This page allows users to view specific daily summaries by selecting a day of the year and utilizing planning tools for orbit calculations. Examine daily variations, assess the influence of spacecraft events, and analyze the auroral emissions and atmospheric phenomena across different local times. The interactive tools offer insights into noise sources, emissions, and limb profiles, making it ideal for researchers and enthusiasts alike.

E N D
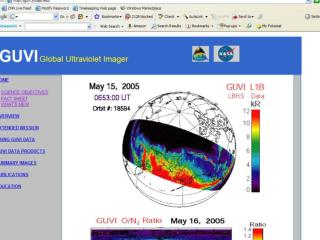
This is the page to go to to look at the GUVI data in the form of images Shows the data from one orbit
To look at a particular day click on daily summaryyou need the day of year
Tools are on this page – can use these to calculate orbit number, day of year, etc
Click on the “planning tools” link to get here The GUVI calendar tells you if we were in a different mode on a particular day or if there was a spacecraft event.
Entered the date and clicked at bottom of screen to convert to day of year “doy” Now we know that it was day 315
Find the day of year and year on the scroll bar and click on “retrieve image” to see a summary
Scroll down to the disk summary and click to see the larger version of the image
Universal time at the ascending node Or start of the orbit Universal time at the end of the orbit Local time at start of orbit Orbit number Longitude of the ascending node
night It just so happens that the ascending node was on the nightside on this orbit day
Here’s an image 60 days earlier that is for the same local solar time – but the ascending node was on the dayside
aurora arcs Noise from the SAA bubbles The nightside 135.6 nm intensity is proportional to the electron density squared… North South
SAA Radiation belt particles causing instrument noise Bubbles visible?
We went back to the tool to see what day 255 was in terms of date – it was September 11
Glint is a reflection off a surface on the spacecraft and appears just at particular local times and solar zenith angles – because of this it appears as a straight line Use this to see the time history of data during the day
First half of the day Second half of day UT increases towards the left
Additional emission from ring current precipitation – enough that it excited some N2 emission on the nightside arcs When you see red in these images it means there is emission in the N2 lyman birge hopfield or “LBH” bands
SAA Noise in the instrument due to radiation belt particles
Next two images compare the day 313 for 2004 – super storm day – and the 313 for 2003 • We see that there was indeed emission from the limb profile deep in the atmosphere at all wavelengths (seen as sort of a white color) • To make these summary images we just assigned colors to the 130.4, 135.6 and LBH (blue, green, red, respectively) • So the nightside arcs show up as green • The aurora shows up as white • Noise shows up as red (on the nightside) because the LBH color is summed up over a larger area of the detector and the noise is proportional to the area of the detector. • If it was just 135.6 nm recombination we’d see just a high latitude “green” image… don’t see this in 2004…
This is a summary of the limb data- so we are looking at the atmosphere edge on. Altitude rusn vertically in each orbit. Year 2004 Day 313 Star in the field of view (fov)
Year 2003 Day 314
We can see the equatorial ionization anomaly (EIA) on the dayside • The is due to radiative recombination to produce the emission in 130.4 and in 135.6 • The dayglow layer which is created by photoelectron impact excitation (for the oxygen lines at 130.4 nm and 135.6 nm and the N2 LBH bands) and resonant scattering of solar photons (for the oxygen line at 130.4 nm and the hydrogen line at 121.6 nm) is largely confined to altitudes below 300km for all the GUVI colors except the Lyman alpha emission at 121.6nm.
aurora Limb view star Arcs on the dayside
Dayside observations of the arcs • We are going to look at the way the arcs change on the dayside • We can’t readily see them looking down (in the summary images) • We’ll use the limb profile summaries to see them
day arcs stars
Nightside for the same day – near solar max – not like now (hard to see in the summary plots)
This is the tool to use if you want to compare to a location on the ground.
Running the coincidence calculator • On the page you just opened, click on the link “start coincidence planning tool” • This runs a Java application • You will get a window that looks like this -> Note that you have to have Java installed on your machine!
This was generated for the november 2004 storm • We can look at each one of these and see what the viewing geometry looked like • The coincidence occurred for times where the GUVI field of view was within 700 km of the site (this user specifed) • This means that the GUVI field of view was within 700 km of the site • The circle of the site field of view is mapped to the user specified altitude (100 km in this case)
nightside Edge of the guvi swath Spacecraft track Because the GUVI limb is on the nightside (away from the Sun) the limb profiles can be located from these pictures
We can look at the next coincidence • Note that the orbits moved to the west – this helps to get an idea of how the fov moves.
To determine which orbit of GUVI data to get • Go to the GUVI web page that has the “planning tools” • Enter the date and the UT from the coincidence planner • Now you know the orbit number